S&P 500 index chart pattern
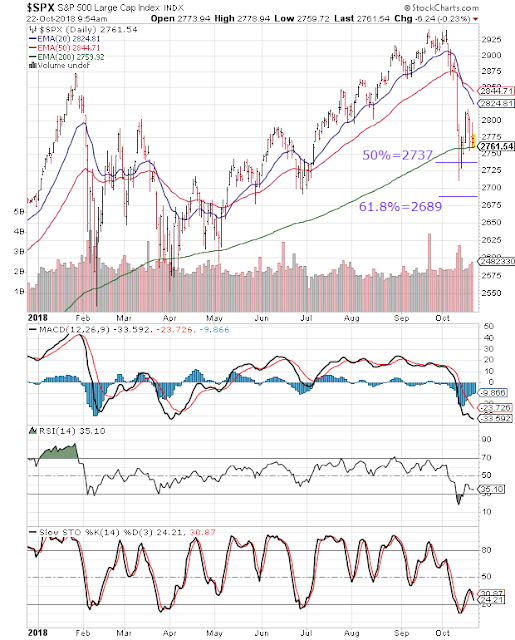
The following comments were made about the daily bar chart pattern of S&P 500 in last week's post: "...it formed an 'inside day' as well as a 'hammer' candlestick pattern. Bulls appear to be ready for a fight back."
The index dropped below its 200 day EMA on Mon. Oct 15, but managed to close above the support zone between 2737 and 2689 (the significance of these levels were mentioned in last week's post). It bounced up to touch an intra-day high of 2817 on Wed. Oct 17, but formed a bearish 'hanging man' candlestick pattern.
Bears used the opportunity to follow a 'sell on rise' strategy. The index dropped to seek support from its 200 day EMA, and closed flat for the week. (At the time of writing this post, the index is desperately trying to stay above its 200 day EMA - but for how much longer?)
Daily technical indicators are looking quite bearish. MACD is falling deeper inside its oversold zone. RSI and Slow stochastic emerged from their respective oversold zones but are moving downwards. Another likely breach of the 200 day EMA can lead to a fall towards the lower edge of the support zone.
On longer term weekly chart (not shown), the index remained below its 20 week EMA but closed above its 50 week and 200 week EMAs in a long-term bull market. Weekly technical indicators are showing downward momentum. MACD is falling below its signal line in bullish zone. RSI is sliding down below its 50% level. Slow stochastic is about to enter its oversold zone.
FTSE 100 index chart pattern

The following comment appeared in last week's post on the daily bar chart pattern of FTSE 100: "Stochastic has stopped falling, and can trigger a technical bounce."
It turned out to be a weak bounce. On Mon. Oct 15, the index formed a small 'reversal day' bar (lower low, higher close) by touching an intra-day low of 6961 - its lowest level in 7 months - but closing higher at 7029.
That triggered a small rally, as the index formed a bullish pattern of 'higher tops, higher bottoms'. Bulls needn't get too excited, as the index appears to be forming a bearish 'flag' pattern.
Daily technical indicators are trying to correct oversold conditions. MACD is below its falling signal line in bearish zone, but seems to be forming a bullish 'rounding bottom' pattern. RSI has just emerged from its oversold zone. Stochastic is still inside its oversold zone.
FTSE gained about 0.8% on a weekly closing basis, but is trading below its three EMAs in a bear market. Any further attempt to rally may face resistance from the falling 20 day EMA.
On longer term weekly chart (not shown), the index formed a small 'reversal' bar and just managed to close above its 200 week EMA but well below its 20 week and 50 week EMAs. Weekly technical indicators are looking bearish. MACD is falling below its signal line in bearish zone. RSI has emerged from its oversold zone. Stochastic is still inside its oversold zone.
1 comment:
Dow Averages Are Giving Bearish Messages
https://stockcharts.com/articles/chartwatchers/2018/10/the-three-dow-averages-are-giving-bearish-messages.html
Post a Comment