Tuesday, July 31, 2012

A modern day parable about profligacy and prudence

Once there was a young man who lived in a small village more than two hours by train from the nearest big city. None in his family had ever studied beyond Class 8 in school. But the young man had a dream – to become a lawyer and save his fellow villagers from being exploited by the zamindar.

He pursued his dream and did become a lawyer, and went on to earn a huge fortune. He spent a lot of his earnings in building a school and a college near his native village. He also bought large tracts of land with fruit orchards and lakes. The land was cultivated to grow food grains. Fruits from the orchards were sold in the market. The lakes were used for fish farming. Villagers were employed to look after the property – and shared part of the bountiful produce.

Things were going well for the villagers – who were prospering. The lawyer was happy that he was able to make a difference to the lives of his fellow neighbours – though he spent most of his time in the big city.

But there were dark clouds on the horizon. The lawyer had a son who was a good-for-nothing spendthrift, who spent most of his time with friends and enjoyed the good life. Despite his best efforts, the lawyer could not make his son mend his ways. He was too busy with his legal practice anyway. So he thought of a plan.

He formed a trust, with his childless younger brother as the trustee. His son was to receive a regular allowance per month, but the trustee was the sole authority for sanctioning any additional expenditure. After the lawyer passed away, the trust came into force – much to the chagrin of his son.

He was soon running through his monthly allowance and kept asking for more from his uncle, the trustee. The uncle was initially indulgent, because he felt sorry that the young man had recently lost his father. But he soon realised that his nephew was taking undue advantage of his indulgence. So, he tightened the screws and refused to sanction extra amounts.

The nephew was taken aback, but instead of mending his ways, he brought over his friends and tried to threaten his uncle with dire consequences. But the uncle refused to budge. So he changed tactics and started imploring and cajoling his uncle for more money.

The uncle said he may re-think provided his nephew met certain conditions. First, he would need to get rid of his freeloader friends. Next, he would need to take an active interest in his father’s property in the village – to ensure that the villagers were doing a proper job of maintenance and upkeep as well as to plug the large amount of leakage of produce that was being siphoned off by various middlemen.

The nephew agreed to the conditions and did prevent his friends from hanging around all the time – though he didn’t really get rid of them. The uncle sanctioned some extra allowance as a quid pro quo. But the nephew showed no interest in looking after the village property of his late father, nor in plugging the pilferage.

Next month, the uncle refused to sanction any extra money, and reiterated his conditions. The nephew promised to change, but his uncle said he won’t sanction anything till he actually saw some change on the ground.

And so the stalemate continues at the time of writing. The nephew (read UPA II) may have good intentions to change, but is unwilling or unable to do so because of his friends (the Mulayams and Mamatas). The uncle (read RBI Governor) has put his foot down and said thus far and no further (by keeping repo, reverse repo and CRR unchanged). The 1% cut in the SLR – from 24% to 23% – was just a token gesture to show good intentions by increasing liquidity without affecting the high inflation rate too much.

Saturday, July 28, 2012

BSE Sensex and NSE Nifty 50 index chart patterns – Jul 27, 2012

BSE Sensex index chart

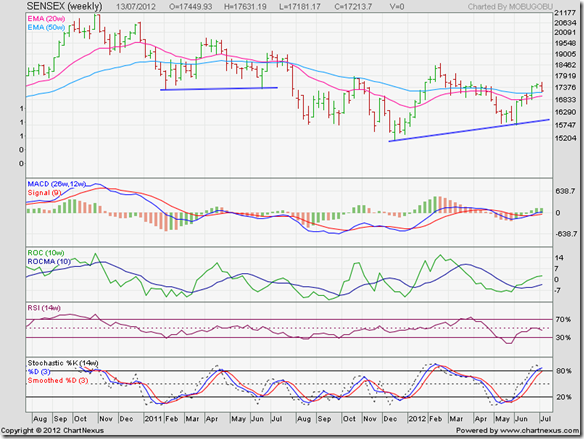
Sensex had a lower weekly close for the third straight week. The 20 week EMA failed to cross above the 50 week EMA and the index is trading below both EMAs. A test of support from the blue up trend line connecting the Dec ‘11 and Jun ‘12 lows appears imminent. A drop below the trend line will give bears total control. An upward bounce with volume support will give bulls some hope.

FIIs turned net sellers for a couple of days, before resuming their buying on the last day of the week. DIIs played counterpoint by buying when FIIs were selling, and selling when FIIs were buying. The big boys are playing some kind of a game which is difficult to understand. FMCG stocks are continuing to shine, which means the bear market is not over yet.

PSU banks are hiding deep and dark NPA secrets. Scant monsoon is threatening a drought situation. The only cheery thing happening is the Olympic Games. Even that is unlikely to extricate the UK economy out of a recession.

SENSEX_Jul2712

Weekly technical indicators are turning bearish. MACD is barely above its signal line, and about to drop into negative territory. ROC is above its 10 week MA, but has started to move down. After a few weeks of struggle, RSI failed to overcome the resistance from its 50% level. Slow stochastic has slipped down from its overbought zone.

Sensex is in a bear market, and likely to seek lower levels.

NSE Nifty 50 index chart

A new president has been elected. Sharad Pawar has been mollified. It is time for some ground-breaking reform announcements, right? Don’t bet on it. There is too much in-fighting among the UPA allies – who are more interested in muscle-flexing than taking policy decisions that will help the economy back on a growth path.

Rate cut hopes are fading. India Inc is postponing capex plans. FDI is slowing down. So are exports. Rupee is depreciating against the US Dollar. Inflation refuses to moderate. Well-known companies are being investigated for fraud and tax evasion. Everything that can possibly go wrong is going wrong.

Nifty_Jul2712

Technicals are reflecting the fundamentals. The daily bar chart pattern of the NSE Nifty 50 index is trading below all three EMAs, which have moved very close to each other. A sharp move usually follows. The only way for the move to be upwards is if FIIs start buying in huge volumes. Possible, but unlikely. So, brace yourself for a sharp down move at any time.

Technical indictors are bearish. MACD is falling below its signal line, and entered negative territory. ROC is negative, but has moved up to touch its falling 10 day MA. RSI has emerged from its oversold zone. Slow stochastic is inside its oversold zone.

Bottomline? Chart patterns of BSE Sensex and NSE Nifty 50 indices are falling back into bear markets, after brief forays into bull territory. The time isn’t ripe for bottom fishing. Stick to regular investments in quality stocks and funds. If in doubt, stay out and preserve cash.

Friday, July 27, 2012

Notes from the USA (Jul 2012) - a guest post

Warren Buffett continues to invest in the US markets. The US Dollar is gaining against the Euro, the Rupee and other world currencies. Gold is no longer in a parabolic rise to the stratosphere. Surely these are signs that the US economy is on its way to a slow but steady recovery?

Not quite, suggests KKP in this month’s guest post. He takes a look at a couple of less known indicators, as well as very long term charts of Dow and S&P 500 indices to make the case for a slowing economy and a stock market that is tantalisingly poised at the edge of a cliff. Do let him know if you agree or disagree with his point of view.

-------------------------------------------------------------------------------------------------------------------------------------

US Economy Slowing – New Indications

We have to look under the surface to see what is really happening in the economy. The reason one has to do this is because there is a lot of political pressure around the world to report what is being ‘expected’ or close to it. GDP, Inflation, Purchasing Managers Report, Manufacturers Report, Unemployment, Layoffs (mostly going unannounced) etc. are variables that constituents around the world feel are being adjusted, or need to be understood like a PhD student.

For example, unemployment figures are reports that include people who are ‘claiming unemployment income’. What happens to a person who was an IT Professional earlier, but is now working at a Walmart (32 hours or more per week)? This person does NOT get counted among the unemployed. What happens to a person who cannot make any more claims for unemployment (since it is allowed only for 26 to 52 weeks)? What about the 55 year old who decides that if he is laid off, he will just do independent consulting or plain retire? Again these people will NOT be counted in the unemployment figures. So, how does one believe the unemployment numbers?

Garbage Indicator: Among the 21 categories of items shipped by rail, which are measured as ‘product shipped’, none have a tighter correlation to GDP than Garbage or Waste. According to a 2010 article, economists Michael McDonough and Carl Riccadonna note that waste has an 82 percent correlation to US economic growth, and it is almost a leading indicator. This is pretty intuitive and should be studied.  The more you produce, the more you throw out. Frankly the results really looks gloomy for the rest of 2012. Waste carloads are way down.

clip_image002

Trucking Indicator: American Trucking Association’s advanced seasonally adjusted (SA) For-Hire Truck Tonnage Index increased 1.2% in June after falling 1.0% in May. June’s increase was the largest month-to-month gain in 2012. However, the index contracted a total of 2.1% in April and May. Compared with June 2011, the SA index was 3.2% higher and YTD tonnage was up 3.7%.

June’s increase was a pleasant surprise, but the lower year-over-year gain fits with an economy that has slowed,” ATA Chief Economist Bob Costello said. Many of the other economic reports are showing slowdown now.

Costello said he’s still concerned about businesses sitting on cash instead of hiring more workers or spending it on capital, both of which would give the economy and tonnage a shot in the arm, as they are worried about Europe and the U.S. fiscal cliff at the end of the year. Costello lowered his tonnage outlook for 2012 to the 3% to 3.5% range due to recent economic weakness.

clip_image002[4]

Currently the Dow, S&P 500 and Nasdaq are very near multi-decade rising channel lines and look to be forming bearish rising wedges (see picture below). Even though rising wedges break to the downside roughly two-thirds of the time, the probability increases if you coincide this topping formation with the Garbage Indicator or the Trucking Indicator. Imagine the impact to the portfolios (globally) as a result of this under-current. Being near the long-term channel/resistance lines for decades means that if the downside begins, then the bottom of these rising channels is a large percentage away!

clip_image002[6]

As a result, protect capital (in case a breakdown occurs) and then follow an upside breakout if that is the eventual outcome. Missing some upside action is a lot better than losing capital!

-------------------------------------------------------------------------------------------------------------------------------------

KKP (Kiran Patel) is a long time investor in the US, investing in US, Indian and Chinese markets for the last 25 years. Investing is a passion, and most recently he has ventured into real estate in the US and also a bit in India. Running user groups, teaching kids at local high school, moderating a group in the US and running Investment Clubs are his current hobbies. He also works full time for a Fortune 100 corporation.

Thursday, July 26, 2012

Stock Chart Pattern - JK Lakshmi Cement (An Update)

The previous update to the analysis of the stock chart pattern of JK Lakshmi Cement was posted back on Mar 9 ‘11 (marked by grey vertical line on chart below). The stock was falling deep into a bear market after touching a high of 85 in Jan ‘10.

Positive divergences were visible in ROC and RSI indicators as the stock fell lower. That observation was the reason for the following comments: “The positive divergences can lead to a rally that may take the stock price above the 48 level. But bulls shouldn’t get too excited. The technical indicators are hinting at only a mild rally…The stock chart pattern of JK Lakshmi Cement doesn’t appear to have found a bottom yet.”

As it turned out, the stock price behaved almost exactly as per expectations. The stock rallied briefly by rising above the 48 level and its three EMAs to touch an intra-day high of 56.80 on Apr 7 ‘11. After a drop to its 20 day EMA, the stock rose again to touch an intra-day high of 56.55 on Apr 21 ‘11. A volume spurt may have indicated a continuation of the rally, but it turned out to be a double-top pattern.

The stock resumed its down trend, and dropped to an intra-day low of 35.50 on Aug 26 ‘11 – just short of the downside target of 34. Note that stock prices tend to fall short of downside targets in bear markets and overshoot upside targets in bull markets.

JKLakshmi Cement_Jul2612

The 18 months daily bar chart pattern of JK Lakshmi Cement formed an interesting ‘W’ shaped double-bottom reversal pattern by rallying up to the 48 level and then dropping to a slightly higher bottom of 36.60 on Dec 29 ‘11.

The subsequent rally coincided with the rally in the broader market. A huge volume spurt propelled the stock’s price well above the 48 level in Feb ‘12. It is very unlikely that the price will fall below 48 in a hurry. Instead of sliding down from its Feb ‘12 top – like the indices and most stocks – the stock entered into a sideways rectangular consolidation pattern.

Rectangular consolidation patterns tend to be continuation patterns, which means the stock price was expected to resume its up trend after the break out from the rectangle. A high volume spike validated the break out earlier this month, and took the stock price to an intra-day high of 83 on Jul 4 ‘12.

After consolidating within a small symmetrical triangle pattern, the stock price has broken out upwards on another volume spurt. But this time, the bulls may have overplayed their hand. Note that all four technical indicators touched much lower tops as the stock price touched a new intra-day high of 86.60 today (Jul 26 ‘12). The combined negative divergences should lead to a correction or consolidation at any time.

All three EMAs are rising and the stock is trading above them – a clear sign of a bull market. However, both the stock price and its 20 day EMA have moved too far above the 200 day EMA. Such a condition usually precedes a correction or consolidation.

Technical indicators are bullish, but showing weakening signs. MACD is positive, entangled with its signal line and moving sideways. ROC is touching its 10 day MA in positive territory, after briefly entering its negative zone. RSI has dropped from its overbought zone, but is above its 50% level. Slow stochastic has re-entered its overbought zone.

Cement is not my favourite sector because it is very capital intensive, and cyclical and seasonal price behaviour makes it an ‘avoid’ for most small investors. But what I like about this company is its steadfast resolve in expanding capacities even during down turns. A share buy-back is ongoing.

Bottomline? The stock chart pattern of JK Lakshmi Cement formed a double-bottom reversal pattern that ended a 2 years long bear market. The stock has not only re-entered a bull market, but has recovered its entire capital loss in seven months. Add on dips – provided you are nimble enough to get out before the cement cycle turns down again.

Wednesday, July 25, 2012

Nifty and Defty charts: a mid-week technical update

Nifty chart

Nifty_Jul2512

The one year daily bar chart pattern of the Nifty 50 index is firmly in the grasp of bears. Note that the expected break down below the ‘rising wedge’ pattern occurred with a gap, which is very bearish. After consolidating for a few days above the 200 day EMA, Nifty has fallen below its long-term moving average - with another gap.

The 50 day EMA has merged with the 200 day EMA. The 20 day EMA has formed a bearish ‘inverted saucer’ pattern and is all set to fall below the 200 day EMA. Another bear market rally came to nought. The only silver lining for the bulls is that Nifty is trading above the blue up trend line joining the Dec ‘11 and Jun ‘12 lows. There is a possibility that the index may find support at the trend line.

Technical indicators are quite bearish. MACD is falling below its signal line, and about to enter negative territory. ROC is negative and below its 10 day MA. RSI and slow stochastic have entered their oversold zones, and may stay there for a few days like they did a couple of months ago.

A test of support from the blue up trend line seems a distinct possibility. A drop below the trend line will be very bearish.

Defty chart

S&P CNX Defty_Jul2512

Bears are in complete control over the Defty chart – despite buying by FIIs through most of the month. The index dropped with a gap below the entangled 20 day and 50 day EMAs, and is getting ready to test the support level of 2960. Will the support hold?

Technical indicators are not holding out much hope. MACD is below its signal line, and has slipped into negative territory. ROC is also negative, and below its 10 day MA. RSI and slow stochastic have entered their oversold zones. A breach of 2960 can drop the Defty to much lower levels.

Bulls are praying for rain and some reform announcements from the government – neither of which have been forthcoming. The fact that FMCG stocks have come out with good results and are trading near life-time highs is an indication that the bear market isn’t over yet. But it will be. Neither bull nor bear markets last forever.

Tuesday, July 24, 2012

Gold and Silver chart patterns: an update

Gold Chart Pattern

Gold_Jul2312

For the past two week’s, the daily bar chart pattern of gold has consolidated sideways with a slightly downward bias. Up moves faced resistance from the falling 50 day EMA. Down moves stayed above the 1540 level. All the three EMAs are moving downwards and gold’s price is trading below them – a clear indication of a bear market in progress.

For the past 2 months, red volume bars on down days have been noticeably taller than green volume bars on up days. Stronger volumes on down days is a sign of distribution. Is gold’s price in the process of bottoming out? One can never be certain, but the bearish technical indictors are suggesting otherwise.

MACD is entangled with its signal line, and moving sideways in negative territory. RSI is meandering sideways below its 50% level. Like RSI, slow stochastic has spent the last two weeks below its 50% level.

There will be a break out from the consolidation zone – which can be thought of as a large symmetrical triangle that has been forming since gold’s price hit its May ‘12 low. Since consolidation patterns tend to be continuation patterns, the likely break out is downwards. However, triangles are quite unreliable, so it may not be a good idea to go short just yet.

A convincing break below 1525 can be very bearish, and a shorting opportunity – for reasons mentioned in the previous post. Up moves are likely to face resistance from the falling 50 day and 200 day EMAs.

Silver Chart Pattern

Silver_Jul2312

The 6 months daily bar chart pattern of silver is in a bear market and hovering dangerously close to the critical support level of 26. Bulls are desperately defending the support level, as can be seen from the higher volumes on up days. But the 20 day EMA has effectively resisted all up moves, despite a couple of intra-day breaches.

The 50 day and 200 day EMA are sliding and the distance between them is increasing. Such a condition is often followed by a counter-trend rally. But the bulls haven’t been able to muster up enough follow-up buying to start a proper rally.

Technical indicators are bearish. MACD is creeping up above its signal line, but both lines are in negative zone. RSI and slow stochastic are both falling below their 50% levels. Bulls are on the verge of being overwhelmed by the bears.

Monday, July 23, 2012

Stock Index Chart Patterns: S&P 500 and FTSE 100 – Jul 20, ‘12

S&P 500 Index Chart

SP500_Jul2012-001-001

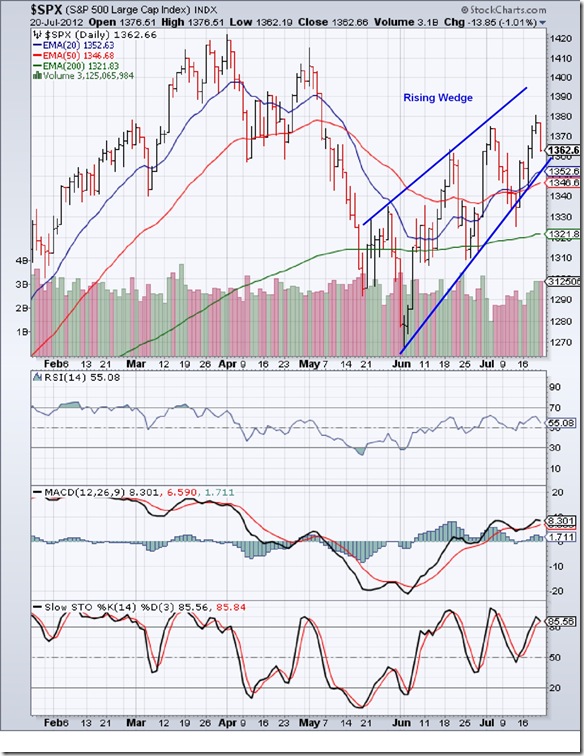
The 6 months daily bar chart pattern of S&P 500 index spent another week of trading within a bearish ‘rising wedge’ pattern. Volumes rose as the index climbed up – raising bullish hopes. After touching an intra-day, weekly and monthly high of 1380 on Thu. Jul 19 ‘12, the wheels appeared to come off the index wagon.

May be it was the sudden rise in the unemployment claims that caused the high volume drop on Fri. Jul 20 ‘12. Or, it could have been some prudent profit booking. The reasons are immaterial. What is material is that the index is falling short of the upper edge of the wedge on every rise, and is in danger of breaking down below the wedge.

Why? Because of negative divergences in RSI and slow stochastic. Both are in bullish zones, but touched lower tops as the S&P 500 index reached a higher top. All three EMAs are moving up and the index is trading above them. Technically, the index is in a bull market. So, there is no need to sell in a panic.

Hold with a stop-loss at 1340. A drop below the 200 day EMA can be very bearish.

FTSE 100 Index Chart

FTSE_Jul2012-001-001

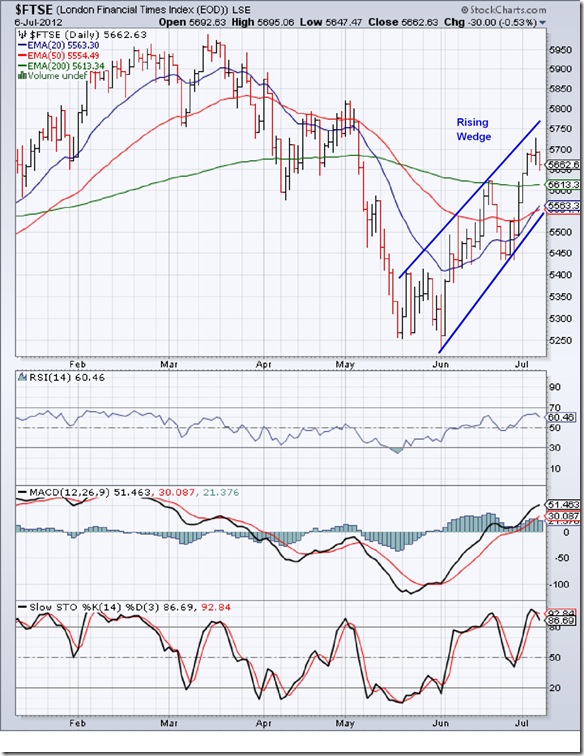
Looks like the 6 months daily bar chart pattern of the FTSE 100 index had its few days in the sun – much like a typical English summer. Dark clouds are gathering on the horizon and the sky is about to fall. The index spent another trading week above its 200 day EMA, but touched a lower top and dropped to the lower edge of the bearish ‘rising wedge’ pattern.

Technical indicators are bullish, but showing clear signs of weakness. MACD is entwined with its signal line in positive territory, but starting to slip down. RSI is falling towards its 50% level. Slow stochastic found resistance from the edge of its overbought zone, and is moving down. (At the time of writing this post, the FTSE index has lost more than 2% and trading below the wedge and all three EMAs.)

The rally from the Jun ‘12 low was a bear market rally, which gave an opportunity to sell.

Bottomline? There is no reason to revise last week’s conclusions: “Chart patterns of the S&P 500 and FTSE 100 indices are trading within bearish ‘rising wedge’ patterns from which the likely break out will be downwards. Patterns don’t always repeat on technical charts, but it is prudent not to bet against a clearly visible bearish pattern. Caution should be the watchword.” 

Saturday, July 21, 2012

BSE Sensex and NSE Nifty 50 index chart patterns – Jul 20, 2012

BSE Sensex index chart

Not much has changed on the ground in the past week. FIIs were net buyers while DIIs were net sellers. This has been a feature in the month of July ‘12. The Sensex closed slightly lower for the week but managed to stay above the 200 day EMA. The 50 day EMA is trying to cross above the 200 day EMA, but hasn’t been successful so far.

The RBI governor has pretty much put his foot down about cutting interest rates unless inflation falls noticeably. Q1 results haven’t been great. The monsoon is below expectations. The only trigger left for the market to go up is announcement of some big-ticket reforms. It may be premature to expect any bold moves from this government – which is too busy fighting coalition skirmishes.

SENSEX_Jul2012

Thanks to FII buying, the index hasn’t crashed – in spite of the gap-down fall below the ‘rising wedge’ pattern. But the three EMAs are beginning to converge, which means a sharp move may be around the corner. The probability of a downward move seems higher than an upward move.

Why? Because technical indictors are looking bearish. MACD is positive, but has crossed below its signal line and sliding down. ROC is negative and below its 10 day MA. RSI has dropped below its 50% level. Slow stochastic has fallen sharply and is just above its oversold zone.

Bulls will try to defend the 200 day EMA (at about 17050). Bears seem to be gradually gaining the upper hand.

NSE Nifty 50 index chart

The election for the new president is over, and the result is a foregone conclusion. Pranab Mukherjee has been selected to steer the UPA out of any mess if the 2014 general elections create a hung parliament. Promoting Rahul Gandhi to a ministerial post is another strategy with 2014 in mind. Staying in power at any cost is the motto of modern day politicians.

Nifty_Jul2012

The ‘reversal week’ bar on the weekly bar chart pattern of the Nifty 50 index a week ago had signalled the end of the intermediate rally from the low of 4770 touched in the week ending Jun 8 ‘12. The index received good support from its 50 week EMA last week.

As long as the index remains above the blue up trend line joining the Dec ‘11 and Jun ‘12 lows, the bulls will remain hopeful. A break down below the trend line - currently at 4850 - will give the upper hand to the bears.

Weekly technical indicators are looking bullish, but there are signs of weakness. MACD is positive and above its signal line, but not moving up. ROC is positive and rising above its 10 week MA. RSI is moving sideways near its 50% level. Slow stochastic is on the verge of slipping down from its overbought zone.

Technically, Nifty is in a bear market because the 20 week EMA has failed to cross above the 50 week EMA.

Bottomline? Chart patterns of BSE Sensex and NSE Nifty 50 indices are on the verge of falling deeper into bear markets. If you are getting inner feelings of bullishness – because of smart moves in small-cap and mid-cap stocks – suppress your feelings and look at reality. Stick to tried and tested companies.

Thursday, July 19, 2012

About growing fruit trees and wealth

There is a back yard – about the size of a tennis court – in our house. In that small space, there are four flowering plants, a curry leaf plant, a neem tree, a lemon tree, a custard apple (‘sitaphal’) tree, a guava tree and a couple of papaya trees.

The flowering plants and fruit trees act like an oasis in the middle of the concrete desert of a congested city – drawing all kinds of birds during different times of day. The parrots hang upside down and eat some of the custard apples. Squirrels eat a few guavas. We eat the rest and the papayas. Lemons, curry leaves and neem leaves are used in cooking.

The plants and trees are caringly tended by our gardener, whose favourite phrase is: “After some more time.” Regardless of what we ask him – why the lemons are not growing bigger or when will the papayas ripen or when will you trim the ‘sitaphal’ tree – the answer is the same. After some more time.

So, what does growing fruit trees have to do with growing wealth? After all, money doesn’t grow on trees! Well, the connection is in the process of growing. Ten years after the lemon tree was planted, it bore its first few fruits. Two years later, it started bearing so many fruits that we didn’t know what to do with them. I remember collecting 43 lemons on one particular day.

While trimming the tree to enhance its fruit bearing capabilities, the gardener inadvertently killed it. We were almost in tears. Losing that lemon tree was like losing a family member. Another plant is growing in its place now. When will it start bearing fruits? After some more time.

Wealth doesn’t get built in a day. It has to be grown carefully and with a lot of patience. Special attention should be given to regularly invest your savings in properly allocated assets. Dead branches need to be trimmed off from time to time. And the process continued over several years.

Nowadays, most small investors don’t seem to get it. Thanks to credit cards and EMIs, a culture of instant gratification pervades our psyche. Total novices try out fancy dance steps in the F&O market and lose their shirt. Only after a few setbacks do they learn that fruit trees only bear fruit after some more time.

That is why, the stocks suggested in my Monthly Investment Newsletter are meant for holding periods of 2-3 years. The ones that quickly rise like a rocket, tend to fall back to earth equally fast. They are like weeds that grow very fast during the rainy season, but do more harm than good.

If you have not subscribed to the Monthly Investment Newsletter yet, you have 3 more days to do so. Paid subscriptions will close on July 21, 2012. New subscriptions will be offered next in Jan. 2013.

Related Post

http://investmentsfordummieslikeme.blogspot.in/2012/07/is-making-money-in-stock-market-easier.html

Wednesday, July 18, 2012

A low-risk investment option for uncertain times – a guest post

The stock markets have been in an unbearable state of ennui for quite some time. No clear trend is visible – leaving investors in a state of uncertainty. Without any entry load for funds, commissions have vanished from mutual fund houses. Distributors are no longer interested in pushing funds with fancy names. Most equity funds have been performing poorly.

What are low-risk investment options in uncertain times? In this month’s guest post, Nishit suggests that investors can take a look at Liquid Funds to park their savings, instead of keeping it idle in a current or savings account.

------------------------------------------------------------------------------------------------------------------------------

Some time back, I had written about Gilt funds and the superb returns that they can provide in times when interest rates are falling. Gilt funds usually attract an exit load and redemption takes 3 working days.

One usually keeps a sum of money that can be readily accessed for emergencies in bank FDs or in a savings account. Savings accounts in India usually have a rate of Interest of 4% (Yes Bank with 7% and Kotak Bank with 6% for account balances above Rupees 1 lakh are exceptions rather than the norm).

Is there an option to earn more than the savings bank rate? One can look at Liquid funds. How do Liquid funds score over other debt instruments? They have 3 advantages:

  1. No Exit Loads (some have 0.25% load if exited within 45 days)
  2. Money is credited on the next business day as opposed to 3 days for Gilt funds
  3. Average rates of return have varied between between 7% and 8%

Now to prove my argument, I have selected JM Money Manager Regular Growth fund. In the past 1 year it has given a return of 10.41% and over a period of 5 years an average return of 7.63%.

Liquid funds are especially useful if one is arranging cash for a large transaction and there is a chance that the money may lie idle in a savings account for a while. Liquid funds perform better when interest rates are high. Gilt funds perform poorly in a rising interest rate regime.

Also, liquid funds have low expense ratios in the range of 0.3-0.5% as compared to other mutual funds which charge 1-2%.

Liquid funds are one more way of diversifying your portfolio. Liquid funds are especially handy during year-end and advance tax payout periods where the 91 day T-Bill shows higher rate of returns.

For those interested in debt instruments, Gilt Funds and Liquid funds are two additional savings instruments. A well diversified debt portfolio will have exposure to all these asset classes along with Non-Convertible Debentures.

Liquid funds carry the risk of default by the issuer. If the fund size is small, exit by a large investor can adversely affect the fund. Hence, while selecting a liquid fund, the following factors need to be kept in mind:

  • Size of the fund (should be at least 200 Crores in size).
  • Fund house history.
  • Fund history in terms of number of years the fund has been in existence. A 5 year track record is preferable.

Happy Investing!!

------------------------------------------------------------------------------------------------------------------------------

(Nishit Vadhavkar is a Quality Manager working at an IT MNC. Deciphering economics, equity markets and piercing the jargon to make it understandable to all is his passion. "We work hard for our money, our money should work even harder for us" is his motto.

Nishit blogs at Money Manthan.)

Tuesday, July 17, 2012

WTI and Brent Crude Oil charts: an update

WTI Crude chart

WTI Crude_Jul1612

Two weeks back, WTI Crude oil’s price and its 20 day EMA were both trading far below the 200 day EMA – a condition that is usually followed by a counter-trend rally. However, the following cautionary observation was made: “…crude oil is in a bear market – so the rally is a selling rather than a buying opportunity.”

Note that the rally faced resistance from the falling 50 day EMA, dropped down only to receive good support from the rising 20 day EMA, and is once again testing resistance from the 50 day EMA. Can the rally continue a bit longer?

The bullish technical indicators seem to suggest so. RSI is rising above its 50% level. MACD is above its signal line, and has just entered the positive zone. Slow stochastic has re-entered its overbought zone.

But the rally has been accompanied by sliding volumes. A rally needs rising volumes just like a person needs more oxygen at higher elevations. Without increase in volumes, a rally will stall. Remember that WTI Crude oil is in a bear market. The strategy should be to ‘sell on rises.’

Brent Crude chart

BrentCrude_Jul1612_weekly

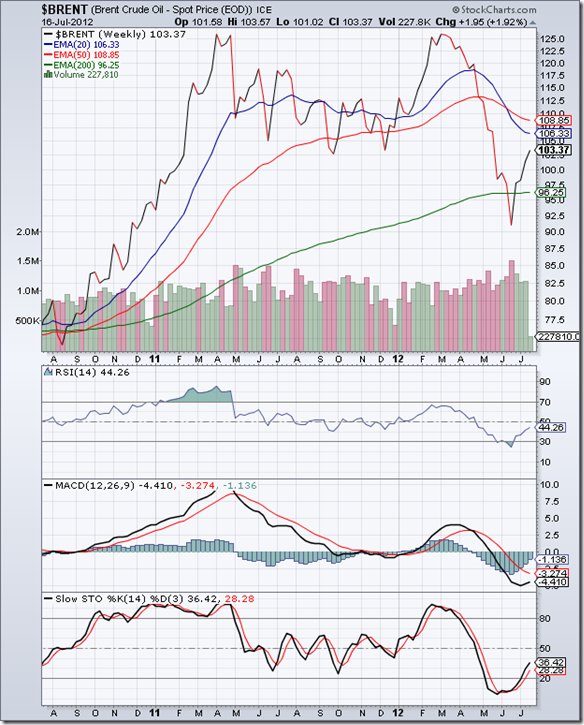
The 2 years weekly closing chart pattern of Brent Crude oil is playing out according to expectations. After forming a double-top reversal pattern, oil’s price dropped sharply below its 200 week EMA but stopped well short of achieving its target of 80.

There are a couple of reasons for not meeting the target price. Downward targets tend to fall short. The more important reason was that OPEC members had made a public statement that they may defend the 90 level by reducing output. So it wasn’t a great surprise that oil’s price bounced up sharply in a counter-trend rally before dropping to 90 on a closing basis.

Observations made 2 weeks ago still hold: “Expect the counter-trend rally to face resistance from the 103 level, which is the ‘valley’ point between the double tops at 126 (touched in Apr ‘11 and Mar ‘12). Above 103, resistances can be expected from oil’s falling 20 week and 50 week EMAs.” Brent Crude oil is currently trading at the 103 level.

Technical indicators are bearish, but showing signs of turning around. RSI has emerged from its oversold zone and is rising towards its 50% level. MACD is negative and below its signal line, but has turned up. Slow stochastic has also emerged from its oversold zone and moving up towards its 50% level. The rally may get past 103, but not much further.

Technically, Brent Crude oil is in a long-term bull market. Bulls may regain control if oil’s price can climb above its 50 week EMA. Bears are unlikely to yield ground without a fight.

Monday, July 16, 2012

Stock Index Chart Patterns: S&P 500 and FTSE 100 – Jul 13, ‘12

S&P 500 Index Chart

SP_Jul13-001-001

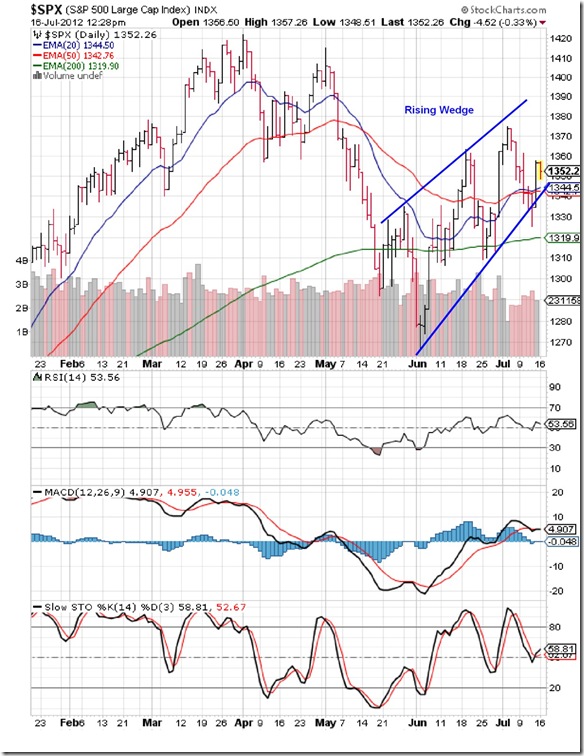
In last week’s post, caution was advised as the 6 months daily bar chart pattern of S&P 500 index had formed a bearish ‘rising wedge’ from which the likely break out was expected to be downwards. Note that there was an intra-day breach below the ‘rising wedge’ accompanied by the highest volumes of the week on Thu. Jul 12 ‘12, but the index bounced right back inside the wedge the next day. Technically, the breach wasn’t a valid one and the index is still trading within the wedge at the time of writing this post.

The 20 day EMA has crossed above the 50 day EMA and all three EMAs are rising with the index trading above all three EMAs. That is the sign of a bull market. So the strategy should be to buy on dips. However, it may be better to err on the side of caution when a bearish pattern is clearly visible. Rising volumes on down days last week is also bearish.

Technical indicators are looking bullish. MACD is positive and entwined with its signal line. RSI is above its 50% level but moving down. Slow stochastic is also above its 50% level. One can hold current positions. Fresh entry is not advisable.

FTSE 100 Index Chart

FTSE_Jul13-001-001

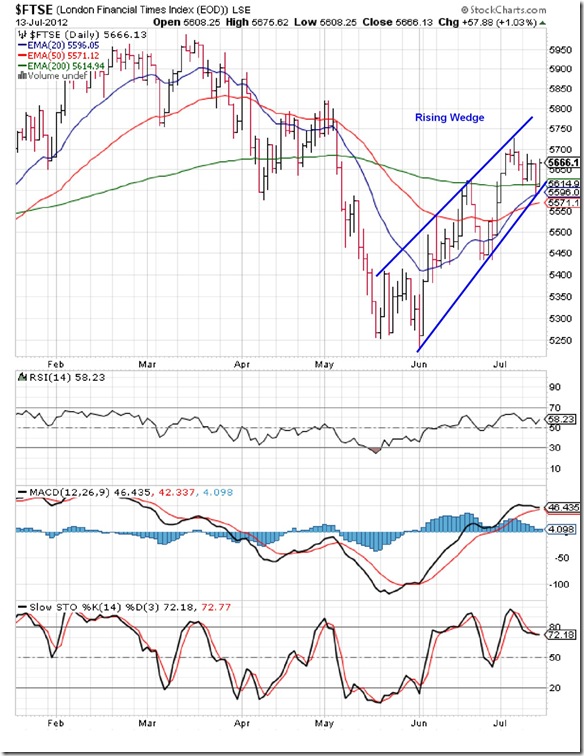
The 6 months daily bar chart pattern of the FTSE 100 index spent the entire week above its 200 day EMA, but is trading within a bearish ‘rising wedge’ pattern. The 50 day EMA is below the 200 day EMA, so the current rally which started from the Jun ‘12 low is technically a bear market rally.

Technical indicators are looking bullish. MACD is positive and about to touch its signal line. RSI is above its 50% level. Slow stochastic has dropped from its overbought zone and sliding down.There may be still some steam left in the rally. However, the possibility of a break down below the wedge can not be ignored.

Bottomline? Chart patterns of the S&P 500 and FTSE 100 indices are trading within bearish ‘rising wedge’ patterns from which the likely break out will be downwards. Patterns don’t always repeat on technical charts, but it is prudent not to bet against a clearly visible bearish pattern. Caution should be the watchword.

Sunday, July 15, 2012

Is making money in the stock market easier than making money as a doctor, lawyer, accountant or engineer?

That is a no-brainer, right? Of course it is much easier to make money in the stock market, isn’t it? You neither need to sit for any admission tests with three-letter acronyms like CAT, MAT, SAT; nor do you have to spend lakhs of Rupees on coaching classes, tuition fees, books, stationery, hostel charges.

Most important of all, you don’t have to spend 4-5 long years in reading thick text books written in English and then appearing for tests every semester and every year to qualify as a stock investor. You can just open a demat account and walk right in to the market and start making money without spending much time, effort or money.

Well, guess what? Because most small investors don’t go through a disciplined and well-planned learning process of several years before entering the market to earn, the chances of making ANY money in the stock market is next to impossible.

So, what about all the stories of acquaintances, friends, and relatives who have become rich overnight? Those are mostly just that – stories. You get to hear about the huge amount of money they made in one or two stocks, but you never get to hear about the even larger amounts they have lost in most of their other investments. No one likes to discuss their failures.

The real tragedy about investors losing money in the stock market is that many such investors are doctors, lawyers, accountants and engineers. They have spent many hours of effort and lots of money to get proper training for their respective professions. But they don’t think twice about spending lakhs of Rupees on a ‘sure-shot tip’ from a friend or a web site.

There are training courses run by the stock exchanges and private educational institutions – but very few people actually avail of these services.They are either too busy or too lazy. It is far easier, and more thrilling to make wild bets on unknown companies in an age-old quest of ‘getting rich quick’.

There are no short-cuts in life, and definitely none in the stock market. You may get lucky once or twice. But if you don’t know what you are doing, you are unlikely to get rich from your stock investments. Building wealth is a planned and long drawn out process. It isn’t rocket science, but you still have to learn the various steps before you can reach your financial goals.

Just like you need good teachers in order to become a good doctor, lawyer, accountant or engineer, you need a good teacher who can guide you through the intricacies of building long-term wealth in the stock market. Unfortunately, very few experienced investors have the time or desire to pass on their experiences to the younger generation. One of the reasons is self-preservation. How will experienced investors make money – if not from novice investors who enter the market in droves?

One of the main reasons for publishing my Monthly Investment Newsletter is to educate young investors about the process of selecting stocks through fundamental analysis, and then deciding on entry/exit points through technical analysis. By receiving monthly technical updates on the selected stocks, investors learn about useful technical concepts like supports, resistances, consolidation and reversal patterns, trend changes from bull to bear and vice versa.

Subscribers of the newsletter also have the option to chat with me on-line to clarify doubts or queries regarding the stocks discussed on my blog and newsletter. If you wish to avail of a paid subscription to my Monthly Investment Newsletter, please do so by July 21, 2012. Subscriptions will be offered next in Jan 2013.

Saturday, July 14, 2012

BSE Sensex and NSE Nifty 50 index chart patterns – Jul 13, 2012

BSE Sensex index chart

It was another week of trading during which the FIIs and DIIs acted at cross purposes. FIIs continued to be net buyers, but stronger net selling by the DIIs swung the scales in favour of bears. Not-so-great Q1 results of Infosys may have triggered stronger selling, but TCS declared reasonable results which partly stemmed the rot.

There was good and bad news on the economic front. IIP numbers were higher than expected at 2.4%, but that number should be taken with a pinch of salt. The previous month’s paltry 0.1% IIP has been reversed downwards to a negative growth rate. Trade deficit came down because of lower imports, which was partly due to lower oil price. But exports went down as well.

SENSEX_Jul1312

The weekly bar chart pattern of Sensex shows a ‘reversal week’ pattern (higher intra-week high and a lower intra-week close) that formed last week. Though the index received support from its 50 week EMA, the support may not hold in the coming week. Such a ‘reversal week’ pattern usually terminates an intermediate rally – like it did when the previous rally got terminated in Feb ‘12.

Note that the index touched a higher bottom in Jun ‘12 than the one it touched in Dec ‘11, but has so far failed to cross above its Feb ‘12 top. A similar pattern was formed a year ago when Sensex touched a slightly higher bottom in Jun ‘11 than the one it touched in Feb ‘11. The subsequent rally failed to rise above the Apr ‘11 top, and the index dropped much lower.

Is the pattern likely to repeat? The possibility can’t be ruled out. Keep your eyes peeled on the second blue uptrend line (currently at about 16000 level). A breach of the trend line can drop the Sensex below its Dec ‘11 low of 15136. Only a move above the Feb ‘12 top of 18524 can push the bears on the back foot.

Technical indicators are giving mixed signals. MACD is above its signal line, and has just entered its positive zone but the histogram isn’t rising. ROC is positive and above its 10 week MA, but its upward momentum is slowing down. RSI is looking bearish. It has slipped below its 50% level. Slow stochastic has entered its overbought zone - where it doesn’t stay for very long during bear phases.

The 20 week EMA is trading below the 50 week EMA, which means the Sensex is technically in a bear market.

NSE Nifty 50 index chart

In last week’s post, a bearish ‘rising wedge’  pattern was drawn on the daily closing chart of the Sensex with the following observation: “There are no certainties in life, and definitely none in technical analysis – but when a bearish pattern is clearly visible, it is best not to bet against it.”

Nifty_Jul1312

Not surprisingly, a ‘rising wedge’ pattern had formed on the daily bar chart pattern of Nifty as well, from which a ‘gap down’ break out occurred last week. While an upward break out should be accompanied by a volume surge for the break out to be valid, no such stipulation is required for a downward break out. However, the ‘gap down’ break out is quite bearish.

The good news for bulls is that the index found support from its 20 day EMA. The not-so-good news is that the 50 day EMA hasn’t been able to cross above the 200 day EMA. A ‘golden cross’ that confirms a return to a bull market is awaited.

Technical indicators are still bullish, but showing signs of slowing upward momentum. MACD is positive, but has crossed below its signal line, and the histogram has turned negative. ROC has dropped sharply below its 10 day MA into negative territory. Such sharp falls are often followed by pullbacks. RSI has dropped from its overbought zone after forming a bearish head-and-shoulders reversal pattern. Slow stochastic has fallen sharply from its overbought zone after forming a bearish rounding-top pattern.

Bears may use any pullback towards the ‘rising wedge’ as an opportunity to sell.

Bottomline? Despite net buying by FIIs, selling by DIIs is upsetting bullish plans. Chart patterns of BSE Sensex and NSE Nifty 50 indices are in danger of falling deeper into bear markets. It is time to be cautious and preserve capital. High inflation and high interest rates are not conducive to a bull market. Regular investments in blue chip companies should not be stopped. But speculative bets should be avoided.

Friday, July 13, 2012

Stock Index Chart Patterns: Jakarta Composite, Singapore Straits Times, Malaysia KLCI – Jul 13, ‘12

Four weeks back, the Asian index charts were trying to escape from the stranglehold of bears. Their struggles appear to be over as bulls have fought back strongly.

Jakarta Composite Index Chart

Jakarta_Jul1312

There are some interesting patterns visible on the Jakarta Composite index chart. After a double-top reversal pattern, the index dropped sharply below all three EMAs. Though the 20 day EMA crossed below the 200 day EMA briefly, it formed a bullish rounding-bottom pattern to cross above the 200 day EMA within a month. The 50 day EMA never crossed below the 200 day EMA, so technically the index never entered a bear market.

The recovery from the Jun ‘12 intra-day low of 3635 has been more gradual than the correction. Though the index climbed above all three EMAs, it touched a lower top followed by a drop to its entwined 20 day and 50 day EMAs and a break below the blue up trend line.

Is the rally over? Not yet. Some times a sideways consolidation can break a trend line without changing the trend. If the index can continue to rise and move past its Jul 4 ‘12 intra-day top of 4091, a bullish pattern of higher bottoms and higher tops will continue. A drop below all three EMAs can change the bullish equation.

Technical indicators are still bullish, after correcting overbought conditions. MACD is positive and above its signal line, but the histogram is falling. ROC is also positive, but has crossed below its 10 day MA and touched a lower top while the index rose higher. The negative divergence is not corroborated by the other three indicators. RSI fell from its overbought zone, but has started moving up. Slow stochastic also fell from its overbought zone, but is above its 50% level.

All three EMAs are rising and the index is trading above them – which indicates a bull market.

Singapore Straits Times Index Chart

Straits Times_Jul1312

Singapore’s Straits Times index corrected swiftly from a triple-top reversal pattern and technically entered a bear market due to the ‘death cross’ of the 50 day EMA below the 200 day EMA. But the recovery has been equally swift.

Note the bullish rounding-bottom patterns formed by the signal line of MACD and the 20 day and 50 day EMAs. The 20 day EMA has crossed above the 200 day EMA and the 50 day EMA should follow soon to technically confirm a return to a bull market.

But there are some dark clouds on the horizon. Volumes have been sliding as the STI has touched higher tops. All four technical indicators are looking overbought. A correction can happen at any time, and will improve the technical health of the chart pattern.

MACD is positive and above its signal line, but the histogram is falling. ROC is also positive, but has crossed below its 10 day MA – indicating slowing upward momentum. RSI and slow stochastic are in their overbought zones, but failed to move higher with the index. Any dip can be used to add to existing positions.

Malaysia KLCI Index Chart

KLCI Malaysia_Jul1312

Malaysia’s KLCI index is in a strong bull market, with all three EMAs rising in tandem and the index soaring to new highs. But it formed a ‘reversal day’ pattern (higher high, lower close) on Jul 12 ‘12 – which may lead to a correction. Note that the index and its 20 day EMA have risen far above the 200 day EMA – a condition that heralds a correction.

Technical indicators are bullish, but showing signs of slowing momentum. MACD is positive and above its signal line, but has stopped rising. ROC is positive and above its 10 day MA, but moving sideways. RSI has slipped below its overbought zone. Slow stochastic has formed a rounding-top reversal pattern inside its overbought zone.

Since the KLCI index is in a bull market, the likely dip will be an opportunity to add to existing holdings.

Bottomline? Asian index chart patterns are back in bull territory after recovering from sharp corrections. Any dips can be used to add to existing positions – but with suitable stop-losses.

Thursday, July 12, 2012

Stock Chart Pattern - Infosys Ltd. (An update)

The previous technical update of the chart pattern of Infosys Ltd. was posted way back in Dec ‘09. The stock was touching new highs on a regular basis and the sky was the limit. The stock was a favourite of foreign and domestic investors and no power on earth seemed capable of stopping its growth trajectory.

A lot of water has flown down the Ganges since then, and even the best-loved companies and leaders eventually reach their level of incompetence. In the case of Infosys, the major mis-step was the decision to rotate the company’s leadership among the original group of promoters. Narayanmurthy was a visionary. Nilekani was a dynamic leader who did a great job of trying to fill Narayanmurthy’s outsize shoes.

The leaders who followed have lacked vision and dynamism. The global economic downturn couldn’t have come at a worse possible time for the company. Devoid of any worthwhile domestic business and inability to transition into high-end IT consultancy services overseas or find any useful outlets for its large cash pile has left the company struggling for direction. The culture of transparency still exists, but the company is no longer able to walk the high road of integrity. The abuse of US visa policies – indulged in by almost all Indian IT companies – have come out in the open.

The company announced cutback in hiring and froze salary increases, leading to increased attrition. The stock market has not taken kindly to the turn of events. Infosys is not, and never will be, a disaster like a Cranes Software or a Suzlon, but it no longer deserves the premium valuation that it has received for more than a decade. The daily bar chart pattern of Infosys Ltd. is steadily and inevitably descending into a bear market:

Infosys_Jul1212

The stock touched an intra-day peak of 3475 on Jan 7 ‘11, but it turned out to be a ‘reversal day’ (higher high, lower close). The subsequent down trend is still ongoing. After forming a double-bottom at 2157 in Aug ‘11, the stock rallied sharply above all three EMAs to touch an intra-day high of 2971 on Oct 28 ‘11.

This time it formed a ‘distribution day’ pattern (open near high, close near low) and started a sideways consolidation for the next 5 months, oscillating about its 200 day EMA. All hell broke loose when Infosys announced its Q4 results in Apr ‘12. Though the company’s performance wasn’t bad at all, the market got spooked by its muted quarterly guidance of future performance.

The stock fell down with a huge gap (marked Gap 1) on massive volumes, forming a ‘panic bottom’ at 2336. After bouncing up a bit, the stock dropped even lower to 2200 on Apr 24 ‘12, which turned out to be a high volume ‘reversal day’ (lower low, higher close). The subsequent rally was weak and formed a bearish ‘rising wedge’ pattern.

A high volume gap down break below the ‘rising wedge’ (marked Gap 2) was apparently triggered after declaration of Q1 results today. Once again, the company’s performance wasn’t that bad, but the annul guidance was bleak. Better sense seems to have dawned on the management who will no longer provide quarterly performance guidance.

Though the results may have provided the trigger for the gap-down break below the wedge, remember that a ‘rising wedge’ is a bearish pattern from which the break would probably have been downwards even if Infosys had declared better results and guidance.

Knowledge of technical analysis can help investors by providing advance warning – even though technical analysis is not a science and doesn’t always follow similar previous patterns. All four technical indicators are looking bearish. A bounce up often follows such a sharp fall on big volumes, but don’t treat it as a buying opportunity, despite the fact that today’s intra-day low at 2216 is close to the Apr ‘12 low of 2200. The stock is likely to breach the Aug ‘11 low of 2157 and fall even lower.

Bottomline? The stock chart pattern of Infosys Ltd is an example of how sentiments can affect the stock of an excellent company. The company is facing some problems which are temporary in nature. It is making profits and has a huge cash pile and no debt. Wait for the dust to settle and the stock to find a reliable bottom before entering. If you are a long-term holder, there is no need to sell in a panic. But partial profit booking never hurts anyone.

Wednesday, July 11, 2012

Nifty and Defty charts: mid-week technical update

Nifty chart 

Nifty_Jul1112

The daily closing chart of the Nifty index is concurrently showing bullish and bearish patterns. Good news for the bulls is that the 20 day EMA has crossed above the 200 day EMA, and the 50 day EMA has formed a bullish rounding-bottom pattern and is about to cross above the 200 day EMA.

The 50 day EMA had crossed above the 200 day EMA in Feb ‘12 and stayed above the long-term moving average for two months. But the bulls could not regain control of the Nifty chart. Will the current attempt be successful? Not if the bearish ‘rising wedge’ pattern plays out as it is supposed to. A break down below the wedge can drop Nifty below its Jun ‘12 low.

Technical indicators are bullish, but showing signs of weakness. MACD is positive and just above its signal line, but the upward momentum has stalled and the histogram is falling. ROC is also positive but is touching its 10 day MA and touched a lower top as the index rose higher. Slow stochastic is inside its overbought zone, but sliding downwards. RSI formed a small head-and-shoulders reversal pattern in its overbought zone, which is a bearish sign.

FII buying has been a feature of the current rally. DII selling has prevented a runaway rally. However, many FIIs are becoming increasingly vocal about the propensity of India’s politicians to be self-serving, corrupt and prone to shooting themselves in the foot. Time may be running out for the UPA government to promote market-friendly policies.

Defty chart 

S&P CNX Defty_Jul1112

A week back, the following comments were posted about the Defty chart pattern: “ROC has moved up sharply above its 10 day MA. But such a sharp move usually heralds a correction.” The correction started before the Defty could move up to test resistance from its falling 200 day EMA.

Technical indicators are bullish, and have corrected overbought conditions. MACD is positive and above its signal line, but is moving sideways. ROC is also positive and above its 10 day MA, but is not moving up. RSI and slow stochastic are just below their overbought zones.

The bear market in the Defty chart will remain in force as long as the index trades below its falling 200 day EMA. Q1 results are unlikely to be good. Inflation and interest rate remains high. GDP growth is slowing down. These are not bullish signs.

Tuesday, July 10, 2012

Gold and Silver chart patterns: bears in no mood to give up control

Gold Chart Pattern

Gold_Jul1012

For the past two months, gold’s price has been behaving like a yo-yo – jumping up each time it falls below 1540 and sliding down whenever it reaches near its 200 day EMA. Down-day volumes have mostly been stronger than up-day volumes since Mar ‘12 – a clear sign of ‘distribution’ from strong hands to weaker hands.

Two week’s back, readers were cautioned that gold’s daily bar chart is forming a large ‘descending triangle’ reversal pattern. A break down below 1525 can be very bearish, and push gold’s price down below 1200. That may or may not happen because technical analysis is not a science. But forewarned is forearmed.

Technical indicators are looking bearish again. MACD is touching its signal line in negative territory. RSI has slipped below its 50% level after a brief move above it. Slow stochastic has almost fallen to its 50% level.

Gold’s price, its 20 day EMA and 50 day EMA are all trading below the falling 200 day EMA – a clear sign that bears are in control. The correction from the Sep ‘11 top is now 10 months old.

Silver Chart Pattern

Silver_Jul1012

Positive divergences in the technical indicators two weeks ago had indicated a possible rally on silver’s daily bar chart pattern. Silver’s price dropped close to the support level of 26 before a brief rally managed to rise past the falling 20 day EMA and the 28 level. Bears used the opportunity to sell.

Silver’s price is trading below all three EMAs and is in a strong bear grip. The only solace for the bulls is that silver is far below its 200 day EMA. Another rally may be around the corner.

Technical indicators are looking bearish. MACD is above its signal line, but in negative territory. RSI and slow stochastic have both dropped below their 50% levels. There is no reason to feel bullish. Any rallies should be used to sell.

Silver’s price chart is forming a large ‘descending triangle’ reversal pattern (not shown) that has very bearish implications if the support level of 26 is breached.

Monday, July 9, 2012

Stock Index Chart Patterns: S&P 500 and FTSE 100 – Jul 06, ‘12

S&P 500 Index Chart

SP500_Jul0912-001-001

In a holiday shortened week, the 6 months daily bar chart pattern of the S&P 500 index displayed a split personality. On the first two days of the week, the index rose to close at a 2 months high of 1374. But all gains were wiped out on the last two days of the week.

Readers should not be surprised at the turn of events. In last week’s post, negative divergences in RSI and slow stochastic had warned that the rally may get stalled. Bulls may start getting worried by the bearish ‘rising wedge’ pattern visible on the chart.

Note that the index failed to reach the upper end of the ‘rising wedge’ before turning down. Supports from the entwined 20 day and 50 day EMAs and the lower edge of the wedge may prolong the rally a bit longer. But a break down below the wedge followed by a drop below the Jun ‘12 low of 1267 is the probable outcome.

Technical indicators are still bullish, but showing signs of weakening. MACD is positive and above its signal line, but the histogram is falling. RSI is heading down towards its 50% level. Slow stochastic has fallen sharply from its overbought zone.

Technically, S&P 500 is still in a bull market as it is trading above all three EMAs. But caution is advised because of the possibility of a downward break below the ‘rising wedge’.

FTSE 100 Index Chart

FTSE_Jul0912-001-001

A bear market rally in the 6 months daily chart pattern of the FTSE 100 index surged past the 200 day EMA. Hope readers paid heed to last week’s advice of selling into the rally.

The entire rally from the Jun ‘12 low has formed a bearish ‘rising wedge’ pattern, from which the likely break out is downwards. Note that the FTSE failed to touch the upper edge of the wedge last week before turning down, which is a bearish sign.

Technical analysis is not a science. Outcomes of previous price patterns don’t always get repeated. However, when a bearish pattern is clearly visible, it is prudent to err on the side of caution.

Technical indictors are looking bullish, but there are weakening signs. MACD is rising above its signal line in positive territory, but its upward momentum is slowing down. RSI is above its 50% level, but has turned down. Slow stochastic is inside its overbought zone, but has also turned down.

The rally may continue a bit longer, but a break down below the ‘rising wedge’ and a drop below the Jun ‘12 low of 5230 are distinct possibilities.

Bottomline? Chart patterns of the S&P 500 and FTSE 100 indices have formed bearish ‘rising wedge’ patterns from which the likely break outs will be downwards. The lows touched in Jun ‘12 may not hold. Bulls should seek greener pastures. Bears look ready to attack.

Sunday, July 8, 2012

Are you a small investor or a stock collector?

To answer that question, one must understand what a stock collector is.

During British rule in India, states were divided into several districts for ease of administration. For each district, an administrative head called a Collector (or a District Collector) was appointed. He was entrusted with collecting taxes from the residents of the district and maintain law and order with the help of the Superintendent of Police. So, the District Collector was essentially a tax collector. Nowadays, the system of administration has changed and a district is headed by a District Magistrate, but the old designation of Collector is still in use.

There are art collectors, who are wealthy individuals who have enough spare cash to splurge on works of art. Paintings and sculptures created by well-known artists cost several Lakhs to several Crores, which are usually displayed in prominent locations of residences and/or offices of the rich and famous. Think Ambanis, Birlas, Goenkas when you think of art collectors.

Then there are (or were) stamp collectors – mostly school children who save on their pocket money to buy stamps from a local vendor; or become pen-pals with school children located in various parts of the world to exchange stamps from different countries to increase the size and variety of their respective collections. Stamp collectors are increasingly becoming a rare breed, thanks to the advent of the Internet, video games, iPads and iPods.

A stock collector can’t really be compared with any of the above categories. However, if you can temporarily suspend your disbelief, then a stock collector can be thought of as a cross breed of an art collector and a stamp collector.

In other words, she spends a lot of money in buying stocks for her collection – but not as much money as an Ambani will pay for a painting by S. H. Raza or a Goenka will pay for a sculpture by Ramkinkar Baij. She may have a large collection of stocks – may be 50 or even 100 - but nowhere near the variety and number of stamps in the collection of a school boy.

Now that the role of a stock collector has been defined, here is the honest answer to the question: Both. That may sound harsh, but it is the truth. Most small investors start out by listening to the advice of others. A friend suggests a stock. A relative who is considered an expert suggests two more. Then your friendly broker gets into the act and suggests some ‘sure shot multibaggers’.

By this time, you have collected more than 20 stocks and decide to do it on your own. Except, you don’t know how. Thank the Lord for the Internet. You can log on to zillions of web sites, blogs and online groups that provide daily Nifty tips, or jackpot packages that promise to turn a Lakh into fifty in 60 seconds. Soon your collection of stocks bloats to triple digits. You end up with 50 stocks each of a few good companies, 100 stocks each of some not-so-good companies and 500 or 1000 stocks of several complete duds.

You have well and truly become a stock collector. How do I know all this? Because I’ve been there and done that (except the Internet part – there was no Internet when I first started buying stocks nearly 30 years ago).

How will you cure the ‘stock collection disease’? By first realising that it is almost as bad as a cancer in any part of your body. The only cure is surgery. What will such a surgery entail? The good news is that you don’t have to visit a hospital or a doctor. The bad news is that you will have to do the surgery (under guidance) and it will be painful – both for your ego and your wallet.

How much will the operation cost? It will be a small fraction of what you have already paid to collect your stocks. But it is FREE for those who become subscribers of my Monthly Investment Newsletter.

Saturday, July 7, 2012

BSE Sensex and NSE Nifty 50 index chart patterns – Jul 06, 2012

BSE Sensex index chart

Right through the past week, FIIs were net buyers and the DIIs were net sellers – the opposing forces resulted in the daily closing chart pattern of the Sensex inching up instead of running up. The 20 day EMA has crossed above the 200 day EMA. The 50 day EMA is forming a bullish rounding bottom pattern and is getting ready to cross above the 200 day EMA. That was the good news.

Now the bad. The entire rally from the closing low of 15965 touched on Jun 1 ‘12 has formed a bearish rising wedge pattern, from which the likely break out is downwards. There are no certainties in life, and definitely none in technical analysis – but when a bearish pattern is clearly visible, it is best not to bet against it.

SENSEX_Jul0612

Technical indicators of the Sensex are bullish. MACD is rising above its signal line in positive territory. ROC is positive and above its 10 day MA. RSI and slow stochastic are both inside their overbought zones. There may be some steam left in the rally.

But there are a couple of concerns. ROC touched a lower top while the Sensex moved higher. When RSI and slow stochastic enter their overbought zones, the probability of a correction increases with each passing day.

If you are long (i.e. you were able to enter at lower levels), maintain a trailing stop-loss and stay invested. If you are feeling ‘left-out’, having missed the rally, remain patient and wait for the likely correction to enter. A break down below the rising wedge may be a good shorting opportunity.

NSE Nifty 50 index chart

Despite all the positive and conciliatory noises coming from the Finance and Commerce Ministries, it is unlikely that the government will try to push through any big-ticket reforms till the Presidential election is over.

Nifty_Jul0612

The weekly closing chart pattern of the Nifty 50 shows rising volumes as the rally completed its 5th week. The 50 week EMA has started to rise. The 20 week EMA is getting ready to cross above the 50 week EMA. The bulls look all set to regain control, but will need to push the index past its Feb ‘12 closing top of 5564 to form a higher bottom-higher top pattern.

Weekly technical indicators are looking bullish. MACD has crossed above its signal line into positive territory. ROC has climbed into the positive zone, above its 10 week MA. RSI has edged above its 50% level. Slow stochastic has risen to the edge of its overbought zone.

Note that Nifty touched a higher bottom on the week ending Jun 1 ‘12, but the RSI and slow stochastic touched lower bottoms. The negative divergences may stall the rally. FIIs seem convinced that Man Mohan Singh will turn the Finance Ministry around and remove some of the recent irritants like the GAAR proposals. DIIs are not so sure.

Bottomline? Chart patterns of BSE Sensex and NSE Nifty 50 indices are looking bullish. But some bearish patterns are also visible. If FIIs continue their buying, both indices will move up. Remember that interest rates and inflation are still quite high. Unless both start coming down, there is not going to be a runaway bull market. Stick to quality large-cap stocks.

Friday, July 6, 2012

Stock Index Chart Patterns – Hang Seng, Taiwan TSEC, Korea KOSPI – Jul 06, ‘12

Five weeks back, Hang Seng, Taiwan TSEC and Korea KOSPI index charts had dropped back into bear markets after brief forays into bull territory. Tests and possible breaches of their previous lows were expected.

All three indices fell to six month lows on Jun 4 ‘12, but touched slightly higher bottoms and embarked on rallies that have taken them past their 20 day and 50 day EMAs. But none of them have managed to cross above their 200 day EMAs. Technically, the indices are trading in bear markets.

Hang Seng index chart

HangSeng_Jul0612

A month long bear market rally from the Jun 4 ‘12 low in Hang Seng has been characterised by diminishing volumes, which is usually the sign of an unsustainable rally. Note that volumes were higher during the sharper rallies in Oct ‘11 and Jan ‘12. There is a good possibility of the current rally fizzling out near the 200 day EMA.

Technical indicators are bullish. Slow stochastic is inside its overbought zone, but forming a double-top pattern. MACD is positive and above its signal line. ROC is positive, but touched a lower top as the index rose higher in Jul ‘12. RSI is above its 50% level, but falling.

The index has formed a bullish pattern of higher bottoms and higher tops. Only a convincing break out above the 200 day EMA can push bears on the back foot. Bears are likely to put up a fight at the 200 day EMA level.

Taiwan TSEC index chart

TSEC_Jul0612

Taiwan’s TSEC index is in the midst of a bear market rally. Though volumes have perked up of late, they remain much lower than the volumes seen during previous rallies in Oct ‘11 and Jan ‘12. The rally is likely to face strong resistance from its 200 day EMA.

Technical indicators are bullish, but showing signs of weakening. Slow stochastic is about to fall from its overbought zone. MACD is above its signal line, but barely positive. ROC touched a lower top and has dropped to its ‘0’ line. RSI is still above its 50% level, but falling fast.

Stage has been set for another bear attack.

Korea KOSPI index chart

Kospi_Jul0612

A bear market rally in Korea’s KOSPI index appears to have come to an end already. The index is facing resistance from its falling 50 day EMA and touched a lower top in Jul ‘12.

Technical indicators are looking bearish. Slow stochastic is above its 50% level, but turning down. MACD is above its signal line, but both are in negative zone. ROC is also negative. RSI touched a series of lower tops while the index was rising, and has dropped sharply below its 50% level.

Bears are regaining control.

Bottomline? Chart patterns of the three Asian indices were in the midst of bear market rallies for the past month. These rallies are coming to an end. Such rallies provide selling opportunities. If you go short in any of the three indices, keep a stop-loss at the 200 day EMA. It may be better to stay away and preserve cash.

Thursday, July 5, 2012

Is it a good time to look at the sugar sector stocks?

Blog readers may be aware of my aversion for sugar sector stocks. However, sugar sector stocks are showing signs of waking up after a prolonged hibernation. It may be a good time to take a look at them, provided you feel that they will make a sweet addition to your portfolio.

Remember that sugar is a commodity sector in which companies neither have much pricing power, nor can they resort to import/export to tide over shortages/gluts because of government interference at every step. That makes it a sector that small investors should avoid.

If you are nimble-footed, have high risk tolerance and know how to get in and out quickly, sugar stocks can give great returns in a short span of time. But you can get badly stuck just as easily. Caveat emptor!

Given below are the charts and brief technical analysis of 10 stocks from the sugar sector – most of them still struggling in bear markets.

Bajaj Hindusthan

BajajHindustan_Jul0512

Bajaj Hindusthan stock has moved above its 20 day and 50 day EMAs on good volume support, but is still trading below its falling 200 day EMA. The stock touched a higher bottom in Jun ‘12, which is a positive for bulls. Already, technical indictors are showing overbought conditions. A correction may be around the corner.

Balarampur Chini

BalrampurChini_Jul0512

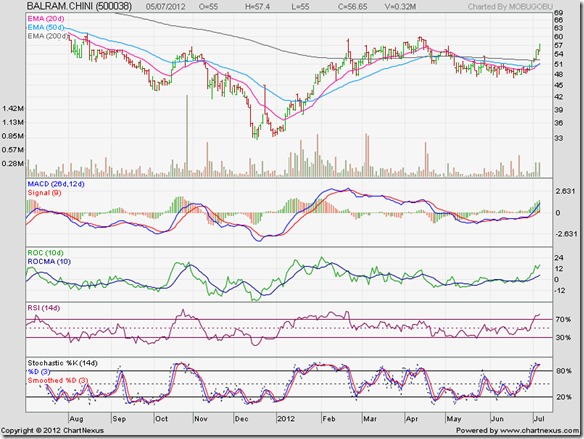
Balarampur Chini stock is beginning to look bullish, after forming a saucer-like consolidation pattern and rising above its 200 day EMA once more. A move above its Apr ‘12 top of 60 will form a bullish pattern of higher bottoms and higher tops. Technical indicators are looking overbought – a pullback to the 200 day EMA is likely.

DCM Shriram Industries

DCMShriramInd_Jul0512

The stock of DCM Shriram Industries is looking similar to the Bajaj Hindusthan stock – but with an important difference. The bottom touched in Jun ‘12 was lower than the one touched in Dec ‘11. The recent price spurt has not seen much increase in volumes. THe stock is likely to drop lower.

Dhampur Sugar

DhampurSugar_Jul0512

The stock of Dhampur Sugar has doubled in price from its Dec ‘11 low and is the only one to have returned to a bull market. All three EMAs converged in Jun ‘12, and a sharp up move followed on strong volumes. The stock is trading above all three EMAs and has formed a bullish pattern of higher bottoms and higher tops. Technical indicators are looking overbought. A pullback is likely. Use it to enter.

Dwarikesh Sugar

DwarikeshSugar_Jul0512

Dwarikesh Sugar stock is showing signs of emerging out of its bear market by forming a saucer-like pattern and crossing above its 200 day EMA on a volume spurt. A pullback to the long-term average was followed by a bounce up. A move above its Jan ‘12 top of 48 will form a bullish pattern of higher bottoms and higher tops.

EID Parry

EIDParry_Jul0512

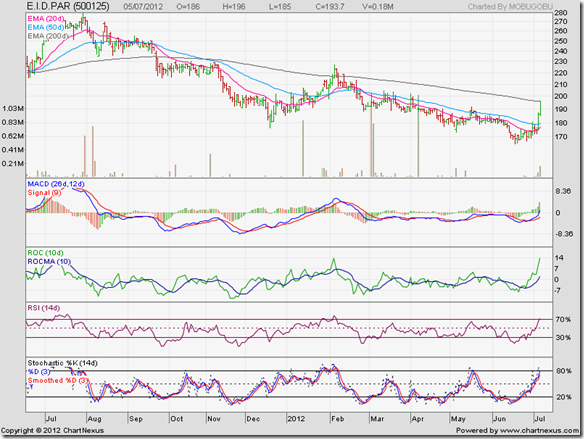
EID Parry stock has risen sharply to test its falling 200 day EMA. It is in a down trend and technically in a bear market, so a correction can be expected after the sharp rise. Technical indicators are looking overbought.

Rajshree Sugar

RajshreeSugar_jul0512

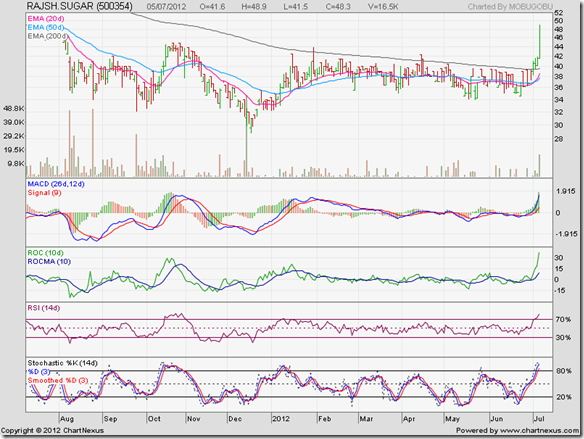
The stock of Rajshree Sugar has risen very sharply above its 200 day EMA on a volume spurt. It has formed a bullish pattern of higher bottoms and higher tops. The ‘golden cross’ of the 50 day EMA above the 200 day EMA will technically confirm a bull market. Technical indicators are overbought – a pullback towards the 200 day EMA is likely.

Shree Renuka Sugar

ShreeREnuka_Jul0512

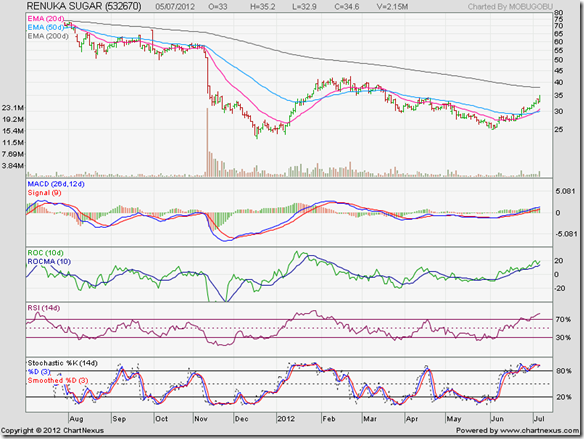
Renuka Sugar stock was a hot favourite in the previous bull market, but the promoter’s ambitions were not matched by business savvy or execution. Note the high volume ‘panic bottom’ formed in Nov ‘11, followed by a drop to a lower bottom in Dec ‘11. An example of the old stock market adage: ‘Panic bottoms’ seldom hold. The stock touched a higher bottom in Jun ‘12, but remains in a bear market.

Simbhaoli Sugar

SimbhaoliSugar_Jul0512

The stock of Simbhaoli Sugar is trying to get out of the clutches of bears. Positive divergences in all four technical indicators - which touched higher bottoms while the stock dropped lower – preceded the current rally. Technical indicators are looking overbought. Expect the bears to attack again.

Ugar Sugar

UgarSugar_Jul0512

The stock of Ugar Sugar has formed a bullish rounding bottom pattern to move above its 200 day EMA. A rise above its Feb ‘12 top of 16 will form a bullish pattern of higher bottoms and higher tops. The stock trades in low volumes – so getting in and out may become an issue.

[Note: I don’t track the sugar sector, and have very little idea about the fundamental strength (or lack of it) of these stocks. Please do your own due diligence.

If you are interested in fundamentally strong mid-cap and small-cap companies, you can subscribe to my Monthly Investment Newsletter. Paid subscriptions will remain open till Jul 21 ‘12.]