Thursday, August 30, 2012

Notes from the USA – a guest post

In our rush to get into the stock market – whether buying mutual funds or individual stocks – we often forget that other people are likely to be dependent on the wealth we create through our savings and investments. It could be elderly parents, or a differently-abled relative or our own spouse and children. Accidents can and do happen – and warning bells do not announce them. What if some untoward incident robs us of our ability to work or even cost our life?

In this month’s guest post, KKP gives the low-down on why, when and how to buy a Life Insurance policy. He highlights the fact that a term life insurance policy can be used to protect certain future milestone expenditures.

--------------------------------------------------------------------------------------------------------------------------------------

Ask Good Questions Before Buying Life Insurance

Why protecting ourselves and our family against the unexpected is prudent, and we know it well. Hence we have Life Insurance, Home Insurance, Auto Insurance, Motor-cycle Insurance, Health Insurance, Dental Insurance, Liability Insurance, Accident Insurance, Identity-Theft Insurance, and all sorts of gimmicky Travel Insurance. But, the biggest out of all of these is Life Insurance, and this topic preys on the minds of consumers in a huge way.

We work hard for our money and would like our family to enjoy the fruits of our labour throughout the coming years without having any real catastrophic downfalls due to ‘failure in one corner’. Preparing for our family's future, however, means more than investing appropriately in order to achieve the right combination of growth and stability for our goals and time horizon. For many, it involves purchasing the right amount of various types of insurances during the working years, and for others, it is getting duped by the insurance salesperson who tends to become friends of anyone who purchases a lot of the above types of insurances.

Let’s talk about Life Insurance, which is the biggest ticket item for most. Life insurance can help mitigate the financial impact on our loved ones in the event of our death. So, in essence it is not “Life” insurance, but “Death” insurance. When you stop for a second and think about it, things will start to change in your mind. When ‘death’ occurs, what do we want our family to be left with? That becomes the million dollar question. With a life insurance policy, our family can use the proceeds to help replace lost income, eliminate debt, pay for college, keep a business afloat, or address other financial needs and goals while they adjust to a new life. That should be the SOLE purpose of buying Death Insurance. But, many of us have heard the story differently from the Insurance Salesperson.

How does life insurance work?

A life insurance policy provides a payment in the event of your death that can help protect your family's lifestyle in the absence of your earning power. Here's how it works: When you purchase a life insurance policy, you're buying a contract with the issuing insurance company. The issuing insurance company guarantees that upon your death, it will pay a preset amount to your beneficiaries. The guarantee is subject to the insurance company's claims-paying ability. The proceeds are typically free from income taxes. The insurance company pays your beneficiaries directly, so they receive the funds without the delays and expenses associated with the probate process that governs assets passed down via wills. Depending on the size of your estate, benefits from a life insurance policy may be subject to estate tax.

What types of life insurance are available?

Life insurance policies fall into two general categories: term and permanent. A term insurance policy covers a specific period of time, such as 1, 5, 10 or 20 years. At the end of that period, you normally stop paying premiums and your coverage ceases. A permanent insurance policy covers you until your death, regardless of age - as long as premium payments are up to date. Permanent insurance generally includes an investment component along with the insurance policy, and generally carries higher premiums as a result. Permanent insurance is commonly used for wealth transfer and estate planning purposes. Read that last sentence again. It is used for Wealth Transfers, when an investor possesses ‘wealth’. A lot of families are buying permanent life insurances for their kids, and for themselves, when they should really be buying a College Savings Plan, or A Plan for Kids Marriage etc. There are MORE important lofty goals to conquer before buying permanent life insurances. Sure, it will cost more as one ages, but that is when we will have more money also. The key is to save money towards the shorter term goals first, by paying the minimum you can with term insurance, and investing the rest into a College Savings Plan (for example), or down-payment towards a house or, daughter’s marriage.

Term insurance is generally more affordable, and in many cases more appropriate, for most purchasers. Term insurance allows you to gain access to life insurance with a lot less money than you'd need if you were trying to buy the same amount of permanent insurance. One helpful comparison is the economics of leasing a car versus buying one: You can often get a more expensive car for the same payment by leasing, rather than buying, the vehicle. Or saying it differently, for the same car that you like, the payment will be a lot cheaper.

When is the right time to buy life insurance?

Many people could benefit by having life insurance. In general, when someone else is depending on your income, there's generally a need for life insurance. Remember, it is ‘death insurance’.

You may already have life insurance coverage through your employer (for those working for big companies). Even so, it's usually a good idea to consider purchasing additional coverage independently, because policies you buy outside an employer's plan are portable, meaning your coverage continues even if you lose or leave your job. Also, your employer's coverage may not meet your financial obligations for adequately protecting your family, although generally in the US, it is cheaper to buy through employer than going outside.

It's a good idea to review your need for life insurance whenever a major life event occurs. This is really the crux of the equation. Consider the following events and the ways in which life insurance might help protect your family in each scenario:

  • New home purchase or major home improvements. Life insurance can cover your mortgage or home equity obligations in the event of your death.
  • Marriage. A wedding should prompt you to review your entire financial situation, including your income needs, debt, and other liabilities, and to add a layer of protection for both spouses.
  • Birth or adoption of a child. A life insurance policy can provide protection for your family's increased income needs as well as any debt you may have taken on, including college expenses.
  • New job. A term insurance policy can replace any group coverage you may have had from a former employer, and allow you to increase your coverage amount in accordance with your new salary.

For families with children, if one spouse is staying home, it may be important to have life insurance for that spouse in addition to insuring the primary wage earner. Consider the value of the stay-at-home parent and the services he or she provides. If a premature death were to occur, in addition to being a devastating loss, it would be a tremendous financial strain on your loved ones and might impact the working spouse's ability to continue to make the same living.

Term life insurance can cover future college expenses, funeral and estate expenses, and even business ownership needs. As you consider purchasing life insurance, bear in mind that you'll generally have to provide “evidence of insurability.” This means that before an insurer issues a policy, the company will typically require you to undergo a basic medical screening, often scheduled at your home or workplace. Generally speaking, the better your overall health, the lower your premium will be. Many factors contribute to the price you will pay for insurance, such as your age and your health. Low blood pressure and low cholesterol, along with a healthy body weight, will typically lead to a lower price and it’s usually easier - and less expensive - to buy life insurance in your twenties and thirties than in your forties, fifties, or sixties. Sometimes health issues arise later in life that can make insurance difficult or costly to obtain. None the less, term is very affordable and the events noted above are the best time to consider getting the perfect coverage. Run some models using the calculators provided in the net (search for Insurance Coverage Calculator) and it will provide some good guidance on the amount of insurance you would need. Buy a bit more than what the model is suggesting.

How much life insurance do you need?

There are several ways to go about determining how much coverage you need. One simple method is to buy coverage equal to 5 to 10 times your annual salary, bonuses, etc. Following this rule of thumb, if you make Rs 500,000 annually, you'd buy a policy between Rs 25,00,000 and Rs 50,00,000.

Other methods are more precise and take certain aspects of your financial situation into consideration, such as the capital you've already accumulated, the liabilities you've accrued, and the specific costs you'd like your family to be covered for in the future.

When purchasing term insurance, you'll also have to determine how long you'd like to have the coverage in place. One benchmark to use is the number of years you have until you can comfortably afford to retire, or you will be debt free and have good amount of assets. You may, however, want to consider other scenarios, such as the number of years until all your children complete college, or how much it would cost to replace your income for 10 years.

One of the major benefits of term life insurance is its ability to protect your assets at an affordable price. Take care to avoid buying a policy with premiums you may not be able to afford in the future. It's better to buy a smaller policy with premiums you can comfortably afford than to buy a bigger policy that you have to let lapse because you can't pay the premium, as noted earlier.

As your life progresses, you will likely accrue greater financial responsibilities for your loved ones. Term life insurance can provide the money they need to help meet their expenses and maintain their standard of living.

Hope that this gives a good refresher on what do to about Life Insurance……I used to sell Term Life Policies exclusively, even though Permanent Life Insurance policies would give us 10x more commissions!! It was the right thing to do.

--------------------------------------------------------------------------------------------------------------------------------------

KKP (Kiran Patel) is a long time investor in the US, investing in US, Indian and Chinese markets for the last 25 years. Investing is a passion, and most recently he has ventured into real estate in the US and also a bit in India. Running user groups, teaching kids at local high school, moderating a group in the US and running Investment Clubs are his current hobbies. He also works full time for a Fortune 100 corporation.

Wednesday, August 29, 2012

Nifty and Defty charts: a mid-week update

Nifty chart

Nifty_Aug2912

After breaking out of the large symmetrical triangle pattern earlier in the month, the daily bar chart pattern of the Nifty is pulling back towards the triangle. It has dropped below its 20 day EMA and approaching a strong support zone between 5200 and 5250.

Why is it a strong support zone? Note that the top of the triangle and the 50 day EMA are currently at the 5250 level. If the Nifty fails to bounce up from 5250, it should get stronger support from 5200. 5200 is a long-term support/resistance level. Also, the 200 day EMA and the up trend line connecting the Jun and Jul ‘12 bottoms is also near 5200.

Those who failed to enter on the break out above the triangle may get an opportunity to enter on a bounce up from the 5200 – 5250 zone. However, technical indicators are looking quite bearish – so wait for the upward bounce before entering. A drop below the 5200 level may change bullish plans.

FIIs are still in buying mode. Unless they suddenly head for the exit, a deep correction in the Nifty chart can be ruled out.

Defty chart

S&P CNX Defty_Aug2912

It isn’t a great surprise that the daily bar chart pattern of the Defty is looking a lot more bearish than the Nifty – thanks to the continued weakness of the Rupee against the US Dollar. The index failed to cross above its falling 200 day EMA and has dropped down to seek support from its 50 day EMA.

Bulls can take heart from the fact that the up trend line joining the bottoms touched in Jun and Jul ‘12 is still intact. Technical indicators are bearish, but not too far from becoming oversold. An upward bounce from the 50 day EMA or the up trend line is a possibility, and can be used as a buying opportunity.

Not much has changed on the economic front. No bills are getting passed in the monsoon session of parliament because the BJP has got on a high horse of anti-corruption from which it is unable to dismount. BJP-ruled states are hardly free of scams and corruption. Good monsoon rains in August have made up most of the earlier shortfall. Except for the Saurashtra region in Gujarat, the rest of the country is no longer facing a drought. Any worries about two-wheeler and FMCG companies facing growth problems can be set aside.

Tuesday, August 28, 2012

Gold and Silver chart patterns: an update

Gold Chart Pattern

Gold_Aug2712

Two weeks back, gold’s price was struggling to cross its 200 day EMA. But the 20 day EMA had crossed above the 50 day EMA after 4 months – which was a bullish sign in the short-term. Technical indicators were also bullish, though they were showing signs of weakness.

Positive noises emanating from the US Fed provided the trigger for the bulls to go on a buying spree. Bears were caught off-guard and covered their shorts – adding to the upward momentum. Gold’s price quickly crossed above its 200 day EMA and the resistance level of 1640 to touch an intra-day high of 1680. But it formed a ‘reversal day’ pattern (higher top, lower close).

Such a sharp rise is often followed by a correction or a pullback. The dip can be a buying opportunity. Gold’s price correction from the Aug ‘11 top to the Jun ‘12 bottom was a little less than 20%. On the longer-term weekly gold chart (not shown), the 20 week EMA had merged with the 50 week EMA for the past month, and now both EMAs have started moving up with gold’s price trading above them. These are bullish signs.

Technical indicators are bullish, but correcting overbought conditions. A ‘golden cross’ of the 50 day EMA above the 200 day EMA will technically confirm a return to a bull market.

Silver Chart Pattern

Silver_Aug2712

Silver’s price has risen just as sharply as gold’s price to cross above its 200 day EMA and the psychological 30 level. But the cross above the long-term moving average has not been quite as convincing yet.

Technical indicators are looking overbought, and may be foretelling a correction or pullback to the 200 day EMA. On the longer-term weekly chart (not shown), silver’s price has crossed above its 20 week EMA but is facing resistance from its 50 week EMA.

A bit of correction or consolidation will enhance the sustainability of the current rally, which is showing very good volume support.

Monday, August 27, 2012

Stock Index Chart Patterns: S&P 500 and FTSE 100 – Aug 24, ‘12

S&P 500 Index Chart

S&P 500_Aug2412

The 6 months daily closing chart pattern of S&P 500 index faced a bit of correction after testing its Apr ‘12 top. Such a correction is to be expected near a previous top, and improves the technical health of the chart. Note that the correction stopped short of the 1400 level and the rising 20 day EMA, indicating that bulls continue to hold the upper hand.

The entire rally during Aug ‘12 has been accompanied by falling volumes. For a bull rally to sustain, volumes should pick up – otherwise the index may succumb to the force of gravity. However, as long as the upward trend in the index is intact and its three EMAs keep on rising, there is no reason to get out of the market. Protect your profits with a suitable stop-loss.

Technical indicators are still in bullish zones, after correcting overbought conditions. MACD is positive, but has crossed below its signal line. RSI dropped down after facing resistance from the edge of its overbought zone, but is above its 50% level. Slow stochastic has fallen sharply from its overbought zone, but hasn’t crossed below its 50% level yet.

The index seems to have priced in some form of QE3. If status quo is maintained by the Fed, the index may correct some more. There is also a possibility – however remote – of a double-top reversal of trend. However, that can happen only if the index falls below its Jun ‘12 low.

FTSE 100 Index Chart

FTSE_Aug2412

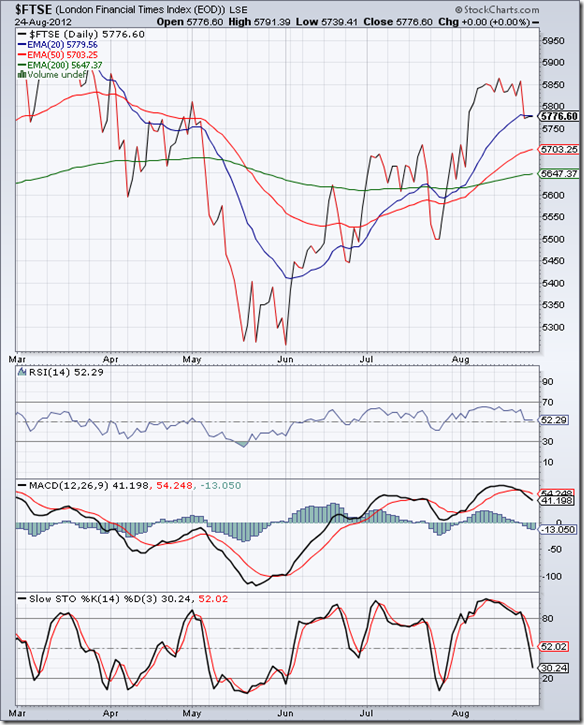
In last week’s analysis, the 6 months daily closing chart pattern of the FTSE 100 index was consolidating near the 5850 level, and was struggling to move higher. Technical indicators had shown slowing upward momentum, and a correction was expected at any time.

The index dropped to its 20 day EMA mid-week, and then clung on to the short-term moving average for the rest of the week. The up trend from the Jun ‘12 low is still intact, but a further drop below the 50 day EMA can change bullish equations.

Technical indicators are beginning to look bearish. MACD is positive, but has formed a bearish rounding-top pattern to cross below its signal line. RSI is barely above its 50% level. Slow stochastic has fallen like a stone from its overbought zone, and looks ready to drop into its oversold zone.

Bottomline? Chart patterns of S&P 500 and FTSE 100 indices have corrected after testing their Apr ‘12 tops. Both indices are in bull markets – so upward bounces from current levels, if supported by rising volumes, can be adding opportunities. However, US and UK economies are still stuck in slow-growth mode. Both indices have rallied for three months and gained more than 10% from their Jun ‘12 lows. Partial profit booking may not be a bad idea.

Saturday, August 25, 2012

BSE Sensex and NSE Nifty 50 index chart patterns – Aug 24, 2012

BSE Sensex index chart

FIIs continued their buying and DIIs continued their selling in another holiday-shortened trading week. For the fourth straight week, Sensex has closed higher but the upward momentum is waning. Market players are probably getting tired of waiting for some positive policy actions.

The Finance Minister has got a clean chit from the Courts and may be able to proceed to turn some of his reform statements and plans into action. But it is very unlikely that he will get much support for contentious issues like GST and FDI in multi-brand retail even from UPA allies – let alone the opposition.

The latter seem hell-bent on stalling all activities of the Parliament by clamouring for the PM’s head over the ‘coalgate’ scandal. Any faint hopes of passing some policy bills into law during the monsoon session of parliament are fading.

SENSEX_Aug2412

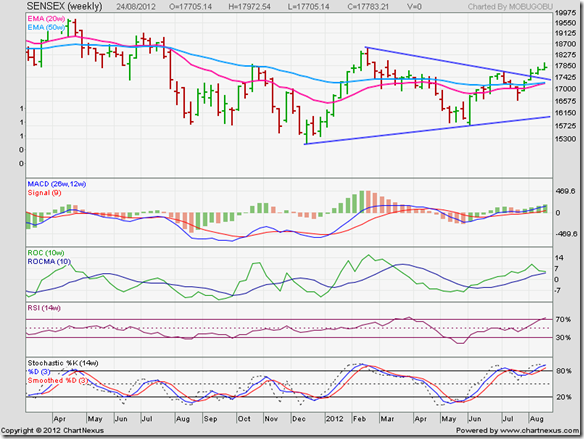
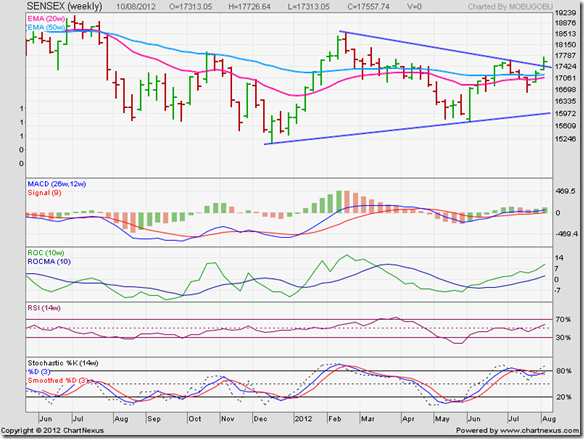
In spite of all the gloom and doom surrounding the global economic down turn, policy inaction and the ever-increasing fiscal and current account deficits in India, the weekly bar chart of the Sensex seems to be merrily moving up. The 20 week EMA has moved up to touch the 50 week EMA for the first time in more than a year.

The index has formed a bullish pattern of higher bottoms and higher tops since rallying from the Jun ‘12 low. A cross above the Feb ‘12 weekly high of 18524 should put the bulls back in control after nearly 2 years.

Weekly technical indicators are looking bullish. MACD is positive, and rising above its signal line. ROC is also positive, but has moved down towards its rising 10 week MA. RSI and slow stochastic have both entered their respective overbought zones.

The Sensex may pullback towards the top of the symmetrical triangle – giving a buying opportunity to those who may have missed out on buying during the break out from the triangle 3 weeks back.

NSE Nifty 50 index chart

The BJP seems to be testing out their options for the 2014 general elections by taking an extreme stand in Parliament – knowing fully well that the PM is unlikely to resign on the basis of a draft report from the CAG. They tried in vain to rope in some of the UPA allies to their cause. Now they are trying to get the support of the Left parties. Short–term political motives are ensuring that Parliament fails to function and pass important bills.

Nifty_Aug2412 

Political shenanigans had very little effect on the upward march of the daily bar chart pattern of the Nifty 50 index. All three EMAs are rising and the index is trading above them. The Nifty has made a bullish pattern of higher tops and higher bottoms. These are all signs of a nascent bull market. A convincing move above the Feb ‘12 intra-day top of 5630 should send the remaining bears running for cover.

Technical indicators are bullish, and correcting from overbought conditions. That should improve the technical health of the Nifty chart and enable the index to gather strength and move higher. MACD is positive and above its signal line, but has touched a lower top. ROC is barely positive, and has crossed below its 10 day MA. RSI and slow stochastic are both inside their respective overbought zones, but succumbing to gravity.

On the down side, the index should receive support from its rising 20 day EMA (at about 5350), and stronger support from top of the symmetrical triangle (at about 5250).

Bottomline? Chart patterns of BSE Sensex and NSE Nifty 50 indices appear to be in the early stages of new bull markets. Weak economic fundamentals and policy inaction have been countered by a steady flow of FII money. As long as the money continues to flow in, selling by DIIs will only slow down the bull rally but won’t be able to stall it. Investors should not expect to get rich in a hurry. Regular investments according to proper asset allocation plans will ensure gradual wealth building.

Thursday, August 23, 2012

Stock Chart Pattern - Havell's India (An Update)

The previous update to the analysis of the stock chart pattern of Havell’s India was posted back in Jul ‘11 (marked by grey vertical line at the left of the chart below). The stock price was correcting from a ‘reversal day’ pattern after touching an all-time intra-day high of 451 in Jun ‘11.

Since the stock was in a bull market but near a new high, investors were advised to buy on dips, but with a strict stop-loss. A fall below 294 would have confirmed a bearish double-top reversal pattern.

The daily bar chart pattern of Havell’s India provided a good opportunity to buy as the price continued to fall before forming a small double-bottom reversal pattern at 313 in Aug ‘11:

Havells_Aug2312

Note that the stock price dropped below its 200 day EMA and dragged both its 20 day and 50 day EMAs below the long-term moving average. The ‘death cross’ of the 50 day EMA below the 200 day EMA technically confirmed a bear market – so how could one buy this particular dip? Was there any certainty that the price would not fall further and drop below 294 – which would be even more bearish?

Those are tough questions that don’t have easy answers. Keen observers may note that the second (slightly lower) bottom on Aug 26 ‘11 was accompanied by slightly higher bottoms in RSI and slow stochastic indicators.

Positive divergences in two of the four indicators wasn’t conclusive evidence of a reversal – but the subsequent rally and the formation of a much higher bottom in Oct ‘11 was a sign that the bulls were regaining control.

The cross above the 200 day EMA on Nov 2 ‘11 on a volume spurt followed by the ‘golden cross’ of the 50 day EMA above the 200 day EMA was conclusive evidence that the bulls were back in control.

Negative divergences in three of the four technical indicators (marked by blue arrows) stalled the bull rally and briefly dropped the stock’s price below the 200 day EMA in Dec ‘11. Note that while the broader market touched a new low in Dec ‘11, Havell’s touched a higher bottom.

The next leg of the bull rally was sharp and coincided with the rally in Sensex and Nifty. After a brief correction down to its rising 20 day EMA in Feb ‘12, the stock price rose to touch a new all-time intra-day high of 616 – nearly doubling in 7 months from its Aug ‘11 low.

However, the stock formed a ‘reversal day’ pattern. The subsequent correction formed a ‘diamond’ reversal pattern (which is like a head-and-shoulders pattern with a bent neckline). A 100 points correction followed, but the stock price has remained above its 200 day EMA.

A second lower top at 614 was touched on Jul 20 ‘12, raising the spectre of a double-top reversal pattern. Once again, three of the four technical indicators showed negative divergences (marked by blue arrows). Technical indicators have corrected from oversold conditions but are still bearish. A test of support from the 200 day EMA is a possibility.

Bottomline? The stock chart pattern of Havell’s India is in a long-term bull market. Periodic corrections and consolidations have strengthened the technical health of the chart. The company is growing well, has strong cash flows, negligible debt and has investor-friendly management – the right combination for the stock to be added to small investor portfolios on dips.

Tuesday, August 21, 2012

WTI and Brent Crude Oil charts: an update

WTI Crude chart

WTI Crude_Aug2112

In the previous post about the 6 months daily bar chart pattern of WTI Crude oil, technical indicators were bullish but volumes were strong on down days. That led to the following remark: “Even if oil’s price manages to cross above its 200 day EMA, it is likely to face renewed selling pressure.”

Note that the initial cross above the 200 day EMA (shortly after the previous post) was met with selling pressure and strong volumes on down days. But the selling was well absorbed by the market – a sign that bulls were gaining in strength. The next up move in oil’s price went easily past the 200 day EMA.

All three technical indicators are looking a bit overbought. Volumes during the later stage of the rally have been falling. Both the 20 day and 50 day EMAs are moving up but are yet to cross above the 200 day EMA. The entire trading pattern for the past 3 months appears to be forming a bearish ‘rising wedge’. There is no need to jump in. A cross above 101 can put the bulls back in control.

Brent Crude chart

BrentCrude_Aug2112_weekly

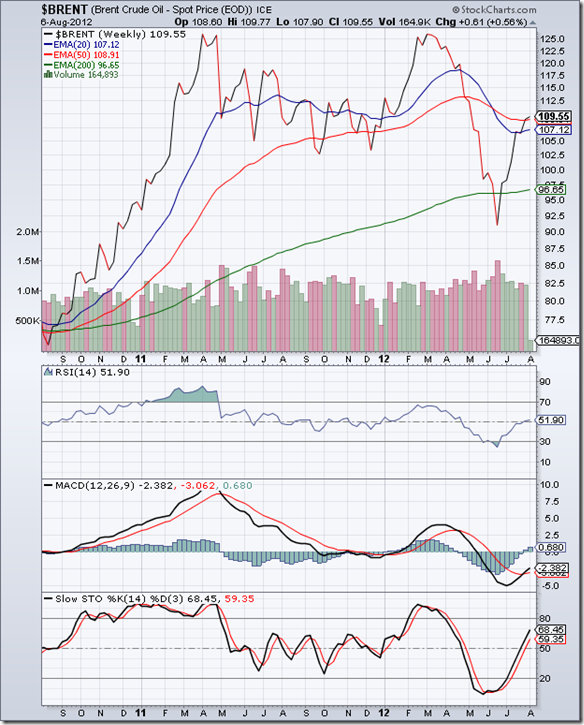
In the past couple of posts, it was mentioned that the 2 years weekly closing chart pattern of Brent Crude oil was in a long-term bull market. The drop below the 200 week EMA in Jun ‘12, following a double-top reversal pattern, seems to have restored the technical health of the bull market.

The 20 week EMA is rising, and may cross above the 50 week EMA soon. However, weekly volumes are sliding, which is bearish. Technical indicators are looking bullish, but giving some mixed signals. MACD is rising above its signal line, but both are still in negative zone. RSI is above its 50% level, but moving sideways. Slow stochastic is well inside its overbought zone. A correction may be around the corner.

The sharp rise in oil’s price over the past 2 months is a bit puzzling. By all accounts, global demand is slowing down because of the economic down turns in Europe, USA and China. Any recovery will need the support of lower oil prices. There are some production issues in the North Sea and there was a big fire in Chevron’s California refinery. But the real reason seems to be speculation based on possible supply disruption from Iran. Protect your investments with appropriate stop-losses.

Monday, August 20, 2012

Stock Index Chart Patterns: S&P 500 and FTSE 100 – Aug 17, ‘12

S&P 500 Index Chart

S&P 500_Aug1712

The 6 months daily closing chart pattern of the S&P 500 index clearly shows that bulls are in no mood to relent. After the briefest of hesitation near its May ‘12 top, the index soared up to test its Apr ‘12 top before taking a breather.

Note that the index, its 20 day and 50 day EMAs are moving up and away from the 200 day EMA with each passing day, increasing the probability of a correction at any time. VIX - the volatility (or fear) index – is now at its lowest point in the past 5 years. In the past, a low point of the VIX has corresponded with a peak in the S&P 500 index.

Technical indicators are bullish, but there are signs of slowing upward momentum. MACD is positive and above its signal line, though the histogram is falling. RSI found resistance from the edge of its overbought zone, and dipped down a bit. Slow stochastic is well inside its overbought zone, and showing no signs of coming down.

There is a possibility that the index may form a double-top reversal pattern – but the reversal can be confirmed only if the index falls below its Jun ‘12 low. Note the gradually falling volumes during the past month, which is not conducive to sustainability of the rally. Wait for a decent correction to enter.

FTSE 100 Index Chart

FTSE_Aug1712

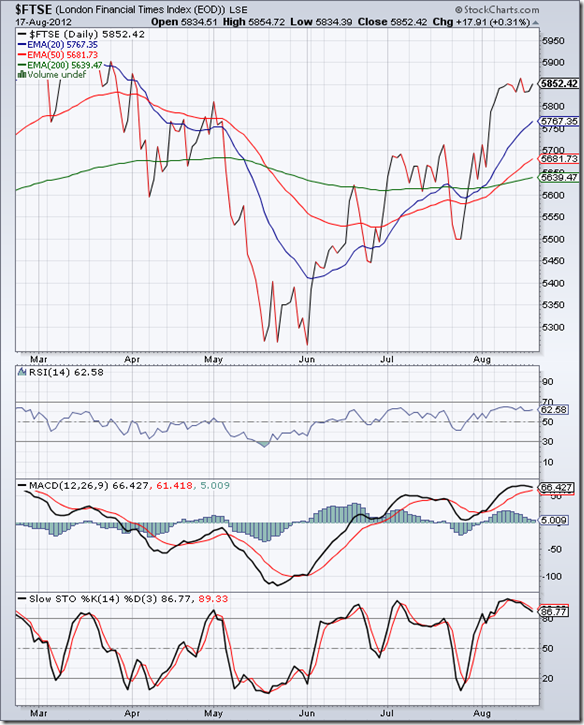
The 6 months daily closing chart pattern of the FTSE 100 index spent the entire week consolidating sideways near its Apr ‘12 top. Both the index and the 20 day EMA are trading well above the 200 day EMA. A correction may be round the corner.

Technical indicators are bullish, but showing definite signs of losing upward momentum. MACD is positive and above its signal line, but has started falling. RSI is above its 50% level, but drifting sideways. Slow stochastic has started descending and may drop below its overbought zone.

The index is technically in a bull market, so a sharp correction can be used to enter.

Bottomline? Chart patterns of the S&P 500 and FTSE 100 indices are showing some hesitancy near their Apr ‘12 tops. Both indices are in bull markets – despite the weakness in the respective economies. Any sharp correction down to the 20 day or 50 day EMAs can be adding opportunities.

Sunday, August 19, 2012

Which sectors will lead the Sensex into a new bull market?

In the previous update to the technical analysis of BSE Sectoral index charts three months back, ‘defensive sectors’ like FMCG and Healthcare were in bull markets that prevented the Sensex from falling down too much. The Auto sector was also holding its own.

Most of the other sectors were in bear markets and dragging the Sensex down. Ever since the Sensex touched its Jun ‘12 low, a flood of FII inflows have changed the bearish sentiment to the point where negative economic news and new scams are being ignored. The Sensex is on the verge of entering a new bull market.

Small investors should start looking at the sectors which are likely to lead the Sensex during the next up move.

BSE Auto Index

BSE Auto Index_Aug12

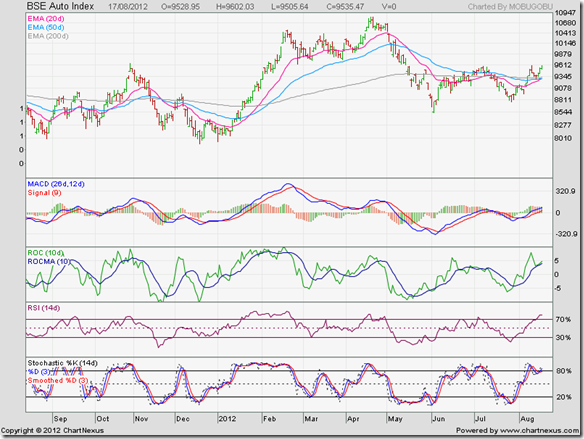
After touching a 52 week peak in Apr ‘12 – thus outperforming the Sensex – BSE Auto index faced a sharp correction and dropped below all three EMAs. It has been trading sideways with an upward bias and is back in bull territory. All three EMAs have come close to each other. Technical indicators are looking bullish. A sharp up move is likely.

BSE Bankex

BSE BANKEX_Aug12

BSE Bankex has been in a bull market since Feb ‘12, except for a brief drop into bear territory in May ‘12. PSU banks have kept the index from moving up, while private banks have kept the index in a bull market.

BSE Capital Goods Index

BSE Capital Goods Index_Aug12

BSE Capital Goods index is struggling to get out of a bear market. As soon as the economy starts to turn around, this sector should be in the forefront. That doesn’t mean one should buy just any stock from the sector, as many of them have been performing poorly. Stock picking skills will be rewarded.

BSE Consumer Durables Index

BSE Consumer Durables Index_Aug12

Technically, BSE Consumer Durables index has been in a bull market since Feb ‘12. The brief drop into bear territory in Jun ‘12 was not confirmed by a ‘death cross’ of the 50 day EMA below the 200 day EMA. The index has been in a sideways consolidation for the past few weeks, but should start to move up.

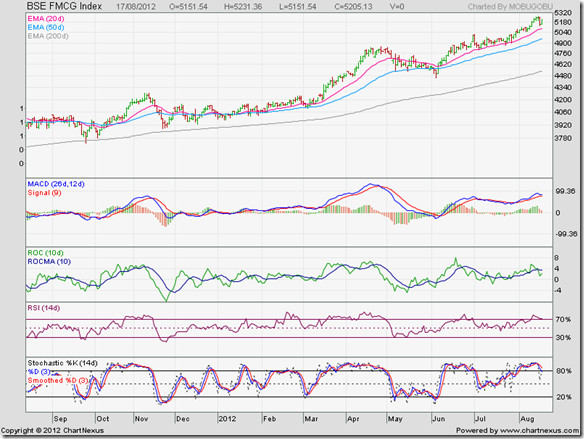
BSE FMCG Index

BSE FMCG Index_Aug12

BSE FMCG index has just gone from strength to strength over the past year. In football terms, this sector is like a good goalkeeper who doesn’t get beaten too often. Because of its ‘defensive’ nature, stocks in the sector are perennially expensive and trade at high P/E ratios. Very low debt, little capital expenditure by established players and strong cash flows make this one of the best sectors to invest in.

BSE Healthcare Index

BSE Healthcare Index_Aug12

BSE Healthcare index is in a clear bull market. If FMCG sector is the goalkeeper, then Healthcare index is a stopper back that tackles opposing strikers before they can take a shot at goal. Small investors must include a few stocks from FMCG and Healthcare sectors in their portfolio to protect the down side during bear markets.

BSE IT Index

BSE IT Index_Aug12

BSE IT index is struggling to get out of a bear market, facing strong resistance from its 200 day EMA. Technical indicators are looking overbought. Some correction or consolidation is expected before the index can move into bull territory. Disappointing performance of Infosys has kept the index subdued.

BSE Metal Index

BSE Metal Index_Aug12

BSE Metal index is in a bear market, trading below its falling 200 day EMA. Economic slow down has hurt the sector, as capital expenditure and new projects have been kept on hold by many companies. At the first sign of economic revival, stocks from the sector should start moving up. Patient investors may start adding stocks of established companies with global reach.

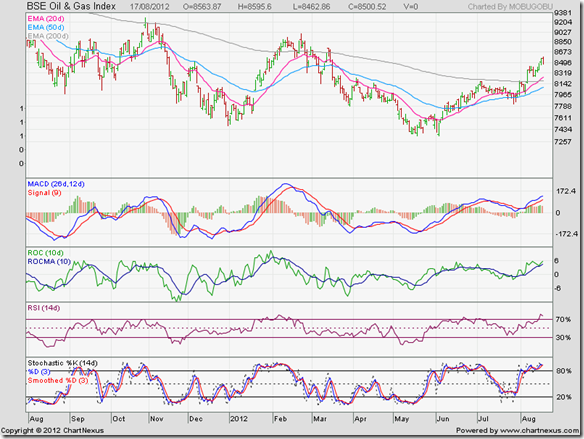
BSE Oil & Gas Index

BSE Oil & Gas Index_Aug12

BSE Oil & Gas index breached its Dec ‘11 low, but is making a determined effort to get out of a strong bear grip. The recent spurt in the price of RIL has helped the index recover to a large extent. But the index is looking overbought. Some correction or consolidation is likely.

BSE Power Index

BSE Power Index_Aug12

BSE Power index tested its Dec ‘11 low in May and Jun ‘12, but did not breach it. That doesn’t mean it will get out of its bear market any time soon. The government should relook at its policies for the sector – otherwise private players who entered the sector will slowly move away. Too many ministries with their own agendas are hurting the growth of the sector. Without adequate power, India’s GDP will grow in low single digits.

BSE Realty Index

BSE Realty Index_Aug12

BSE Realty index is drifting along in a bear market, with no real sign of a revival. Investors should avoid stocks in this sector. Invest in real estate instead. At least there will be some return on investment.

Saturday, August 18, 2012

BSE Sensex and NSE Nifty 50 index chart patterns – Aug 17, 2012

BSE Sensex index chart

There was no let up in FII buying during a holiday shortened week. Sensex bounced up from the top of the symmetrical triangle and touched a slightly higher top, but the long weekend (with Eid holiday on Monday) led to some profit booking. As long as liquidity flows sustain – mainly from overseas ETFs – the current weak fundamentals of the Indian economy will not be able to dampen bullish sentiments.

Stock markets tend to turn around ahead of the economy, and that is what the FIIs are betting on. The first signs of a stock market revival become visible when stocks from the financial sector like banks and NBFCs (Non-banking financial companies), retail and transportation sectors start to rise and consumer durables like home appliances, cars and trucks start showing improved sales.

Stocks like HDFC Bank, M&M Financial Services, Sundaram Finance are at or near their 52 week highs. BSE Consumer durables index is well above its 52 week low, and consolidating sideways. The next up move may take it to a new 52 week high. So, the stage is set for the start of a new bull market.

SENSEX_Aug1712

An upward break out from a large symmetrical triangle, followed by a pullback to the top of the triangle and a bounce up is an indication that bulls are beginning to take control of the 1 year daily bar chart pattern of the Sensex. All three EMAs have started rising and the index is trading above them. Technically, Sensex is back in a bull market.

Technical indicators are bullish, but beginning to correct from an overbought situation. MACD is positive, and above its signal line, but the histogram has started to fall. ROC is also positive, but has crossed below its 10 day MA. RSI is well inside its overbought zone, but showing signs of turning around. Slow stochastic is also inside its overbought zone, but moving sideways.

A bit of correction or consolidation appears likely. On the downside, the rising 20 day EMA and the top of the symmetrical triangle should provide support. On the up side, a cross above the Feb ‘12 top will put bulls firmly in control.

NSE Nifty 50 index chart

How can you tell that the market sentiment has turned bullish? When the stock market ignores regular flow of bad news and indices continue to rise. Disappointing IIP numbers were ignored in the previous week. Friday’s (Aug 17 ‘12) CAG draft report blaming the government for a massive scam in allocation of coal blocks was initially met with selling, but indices recovered somewhat by the end of the day.

Nifty_Aug1712

On the 1 year weekly bar chart pattern of the Nifty 50 index, an upward break out from eight months long consolidation within a large symmetrical triangle is clearly visible. The smaller volume bar last week is not of great concern, because of the mid-week Independence Day holiday.

The 20 week EMA has moved up to touch the 50 week EMA – just as it had done back in end-Mar ‘12. But the Nifty was moving down in Mar ‘12, and the ‘golden cross’ did not take place. Looks like the bulls are determined to push the Nifty into a bull market this time.

Technical indicators are bullish. MACD is rising above its signal line in positive territory. ROC is positive and above its 10 week EMA, but showing signs of slowing upward momentum. RSI has risen to the edge of its overbought zone. Slow stochastic has entered its overbought zone.

Nifty’s breadth indicators (not shown) like the A-D line and TRIN are hinting at a likely correction or consolidation before the up move resumes. On the down side, the top of the symmetrical triangle and the entangled 20 week and 50 week EMAs should provide support. A cross above the Feb ‘12 top of 5630 should restore the bulls’ dominance.

Bottomline? Chart patterns of BSE Sensex and NSE Nifty 50 indices are gradually returning to bull markets. Weakening economic fundamentals and policy inaction by the government do not warrant a runaway bull rally. But strong inflows of FII money seem to have changed market sentiments for the better. Stick to stocks of fundamentally strong, low debt companies with sound management.

Thursday, August 16, 2012

Stock Chart Pattern - Larsen and Toubro (An Update)

The previous update to the stock chart pattern of Larsen and Toubro was posted back in Apr ‘11, when the stock was testing the support/resistance level of 1750 after trying to find a bottom at 1475. Earlier, the stock had touched a peak of 2212 in Nov ‘10 – which was a lower peak than the 2335 level the stock had touched in Nov ‘07.

The stock price consolidated sideways between the two support/resistance levels of 1750 and 1475 for the first 6 months in 2011 before breaking out upwards to touch an intra-day high of 1868 on Jul 8 ‘11, followed by a second slightly lower top at 1864 on Jul 26 ‘11. The small double-top reversal pattern ended the intermediate up move from the May ‘11 bottom.

The stock price dropped back into the consolidation zone between 1750 and 1475 for the next 2 months, and finally dropped below 1475 on strong volumes on Sep 23 ‘11. After receiving good support at 1300 for the next month and a half, the stock fell below 1300 in Nov ‘11 only to bounce up above 1300 in early Dec ‘11 and then fell off a cliff down to 971 in Dec ‘11.

LnT_Aug1612

The 2 years daily bar chart pattern of Larsen and Toubro is a good example of how support and resistance levels can play an important part in deciding when to enter or exit a stock. High volumes during an upward break out through a resistance level is a requirement for a break out to be valid. Downward break outs below support levels need not be supported by high volumes. But a high volume downward break out is likely to turn the support level into a strong resistance level during a subsequent up move.

Note that the upward break out through the 1750 level in Jun ‘11 was not accompanied by significantly higher volumes. The stock price could not sustain above 1750 for very long. On the other hand, the break down below 1475 was accompanied by a sharp volume spurt, which has turned the 1475 level into a strong resistance.

In today’s (Aug 16 ‘12) trade, the stock price has broken out above the blue down trend line that has ruled the chart since Nov ‘10 – but the break out was not accompanied by any volume spurt (marked by blue arrows). It is no surprise that the stock hasn’t yet crossed above the 1475 level.

The 50 day EMA has crossed above the 200 day EMA and the stock is trading above all three EMAs. Technically, the stock is back in bull territory. However, the bulls have plenty of work before they can regain control of the chart.

MACD and ROC are looking bullish, but both are showing negative divergences by touching lower tops. RSI and slow stochastic are also bullish but looking overbought. So, expect some correction or consolidation before the 1475 level is overcome. The next hurdle on the up side will be 1750. Only a convincing cross above 1750 will put the bulls back on top.

Bottomline? The stock chart pattern of Larsen and Toubro seems to be finally getting out of a strong bear grip. One can enter with a strict stop-loss at 1300, and add more on a cross above 1750. But don’t expect any fireworks. The infrastructure sector is still out of favour, and the stock is meant for patient long-term investors.

Wednesday, August 15, 2012

Will a poor monsoon affect your portfolio? – a guest post

This year, monsoon rains have been conspicuous by their absence. While a few parts of the country have received excess rainfall, that has been the exception than the rule. Drought-like conditions are prevailing in many parts. In other parts, rainfall has been scanty to mediocre.

By all accounts, rainfall will be below average this year. What will be the effect of a poor monsoon on your investment portfolio? In this month’s guest post, Nishit looks at a few sectors that may get negatively affected by a poor monsoon and a few that may not do too badly.

----------------------------------------------------------------------------------------------------------------------------------

The monsoon this year is likely to be deficient. Which sectors and stocks will feel the impact? This is a burning question in the minds of investors. Let us try and analyse the impact of a poor monsoon.

The rainfall deficit has shrunk to about 15% from 22% a couple of weeks earlier. Also, the reservoirs are filling up. They are now 96% filled as compared to the last 10 years’ average and 80% filled as compared to last year at this point of time.

With steady rains falling across the country, there should not be any drinking water problem. Agriculture output will be hit, but there will not be food shortages - thanks to the surplus food grains of the previous years.

Having said all this, what will be the impact? The hardest hit will be the farmer. He will have less produce to sell in the markets and consequently less money to spend. All the rural focused sectors will be hit. The hit will not be immediate but come during the harvest season, a few months down the line.

The farmers will not be celebrating the festive season by buying new motorbikes. Thus, the 2 wheeler segment may face the biggest hit. When the times are down, farmers will also not invest in new tractors and farm equipment. This also means tractor manufacturers will face lean times.

In recent times, FMCG majors like HUL and ITC have risen to new all time highs based on uncertainty in the markets. They may take a major hit if the rural population cuts down on spending. Less colas and chips will be consumed. Sectors like IT (Information Technology) will be neutral to a poor monsoon. The banks may take a hit in the form of NPAs in case loans to farmers turn bad.

Amidst all this gloom, the sugar sector - especially the sugar mills having previous stock - will flourish. The farmers may not get much, but the sugar mills will benefit from higher realisations thanks to surplus inventory.

Overall, Indian GDP may come down by 0.6% or so. Surprisingly, in previous years of scanty rainfall, the stock markets have actually done well. The fiscal deficit may increase if the government comes up with any populist schemes. Higher food grain prices may lead to higher inflation forcing the RBI to go slow on interest rate cuts.

In the current scenario, it pays to focus on sectors like sugar and also sectors which may not get impacted much by a poor monsoon. PSU banks with their good dividend yields offer one area where folks with expectations of moderate returns may park their funds.

Cyclical sectors like steel and infrastructure, which are currently beaten down, can be nibbled at. Also, this may be the last chance to lock in at relatively high rate of interests. Bank FDs (ICICI Bank is still offering 10% to Sr Citizens for a period of 4.9 years and Bank of India 9.7%), NCDs (Shriram Transport offered 11.4%), some stocks would be a good mix to be invested in right now.

----------------------------------------------------------------------------------------------------------------------------------

(Nishit Vadhavkar is a Quality Manager working at an IT MNC. Deciphering economics, equity markets and piercing the jargon to make it understandable to all is his passion. "We work hard for our money, our money should work even harder for us" is his motto.

Nishit blogs at Money Manthan).

Tuesday, August 14, 2012

Gold and Silver chart patterns: bulls try to fight back but bears rule

Gold Chart Pattern

Gold_Aug1312

For the past three weeks, the closing chart pattern of gold made two attempts to climb past the 200 day EMA. On both occasions, bears overwhelmed the bulls with their selling. Gold’s price has been in a sideways consolidation mode since touching a low of 1540 in May ‘12.

Technical indicators are bullish, but showing signs of weakness. RSI is above the 50% level but falling. MACD is positive and above its signal line, but the histogram is falling. Slow stochastic has dropped down after touching the edge of its overbought zone.

The good news for the bulls is that the 20 day EMA has crossed above the 50 day EMA after spending 4 months below it. The bad news is that gold’s price is still trading below its falling 200 day EMA. In longer-term chart (not shown), gold’s price has been consolidating within a large ‘descending triangle’ pattern, since forming a double-top reversal pattern a year ago.

A fall below 1540 will be very bearish. On the upside, only a convincing move above 1640 will form a bullish pattern of higher bottoms and higher tops. Savvy traders can trade the range between 1560 and 1620.

Silver Chart Pattern

Silver_Aug1312

In the past three weeks, the closing chart pattern of silver made two abortive attempts to move above the 50 day EMA. On the first occasion, it retreated hastily in the face of strong bear selling. On the second occasion, it formed a small rounding-top pattern and dropped down.

Technical indicators are bullish, but upward momentum is dissipating. RSI is above its 50% level but falling. MACD is barely positive and above its signal line. Slow stochastic has slipped down from its overbought zone.

Volumes have been strong on down days (note the red volume bars). Silver is trading well below its falling 200 day EMA, and is in a bear market. Silver’s price has been in a 15 months long down trend since touching a peak back in Apr ‘11. Only a convincing move above the 200 day EMA may change the trend. A fall below 26 can open up much lower levels.

Monday, August 13, 2012

Stock Index Chart Patterns: S&P 500 and FTSE 100 – Aug 10, ‘12

S&P 500 Index Chart

S&P 500_Aug1012

The 6 months daily closing chart pattern of the S&P 500 index is hesitating a bit near its May ‘12 top. Such behaviour is to be expected – not because charts have memory, but because market participants certainly do.

Note that the last leg of the zig-zag up move has been accompanied by steadily falling volumes, which is bearish. The index has moved too far above its rising 200 day EMA. The time is ripe for some profit booking.

Technical indicators are bullish, but the upward momentum is slowing down. RSI is above its 50% level, but moving sideways. MACD is positive and above its signal line, but stopped rising. Slow stochastic is well inside its overbought zone, and also moving sideways.

New claims for unemployment benefits are falling slowly. New jobs are also being added slowly. A double-dip recession may be off the table, but the US economy is far from a robust growth rate. 

FTSE 100 Index Chart

FTSE_Aug1012

The 6 months daily closing chart pattern of the FTSE 100 index sailed past its May ‘12 top, but stopped short of its Apr ‘12 top. The 50 day EMA has crossed above the 200 day EMA – the ‘golden cross’ technically confirming a return to a bull market.

Technical indicators are bullish, but showing signs of slowing upward momentum. RSI is above its 50% level, but turning down. MACD is positive and above its signal line, but the histogram has started to fall. Slow stochastic is well inside its overbought zone, but moving sideways.

Bottomline? Chart patterns of the S&P 500 and FTSE 100 indices are showing some hesitancy near May ‘12 and Apr ‘12 tops respectively. Some profit booking can be expected. Up trends from the Jun ‘12 lows are intact. Any sharp correction down to the 20 day or 50 day EMAs can be adding opportunities.

Saturday, August 11, 2012

BSE Sensex and NSE Nifty 50 index chart patterns – Aug 10, 2012

BSE Sensex index chart

The negative IIP number was taken in its stride by the stock market, an indication that sentiments were bullish. FIIs continued to be net buyers, which is a bit worrying. Most FIIs have gone on record saying India is more expensive than other emerging markets, and governance and policy issues are making it less attractive for investments.

Then why are they buying? Or, is it round-tripping of Indian money in the garb of FIIs? There was a concern that Iran is pouring money into India, which may be used for terror funding. SEBI hasn’t been very pro-active in its methods and actions, so the truth may never come out.

As small investors, we need to worry more about capital preservation than trying to make windfall gains. Choosing fundamentally strong, low debt companies with investor-friendly management who have proven their worth over several years and holding stocks of such companies over the long term is the way to building wealth. Slowly, but surely. Stay away from companies that declare net profit growth of 350% while their top line shrinks by 30%.

SENSEX_Aug1012

The weekly bar chart pattern of Sensex has broken above the large symmetrical triangle pattern within which it was consolidating for the past eight months. The 20 week EMA is getting ready to cross above the 50 week EMA – the ‘golden cross’ will technically confirm a return to a bull market. The bulls will try to avoid a repetition of the situation during Mar and Apr ‘12, when the 20 week EMA came close to the 50 week EMA, but failed to cross above it.

Technical indicators are looking bullish. MACD is rising above its signal line in positive territory. ROC is also positive and is moving up above its 10 week MA. Both RSI and slow stochastic are above their 50% levels. The Feb ‘12 top of 18524 should be the next target for the bulls. Crossing it would form a bullish pattern of higher tops and higher bottoms. If the FIIs continue their buying spree, that target could be easily achieved.

NSE Nifty 50 index chart

Q1 results announced so far have shown top line growth but bottom line shrinkage, particularly for PSU companies. Economic growth is slowing down, but not enough to change RBI’s declared policy of curtailing inflation at the cost of growth. There is unlikely to be any interest rate reduction in the near-term. Poor monsoon rains may further stoke the inflation fire.

Stock markets may not perform well in a high interest rate regime. Near-zero interest rates have fuelled the rise in US and Europe stock markets, but haven’t helped to increase the growth momentum. Quantitative easing may have saved the large banks from collapsing, but the cash infusion has been diverted to the stock markets instead of being used for productive corporate loans. Similarly, RBI’s efforts at easing liquidity constraints by cutting CRR and SLR rates haven’t really translated into capital expenditure by India Inc. A period of slow growth and high inflation is likely to continue for some more time.

Nifty_Aug1012

After breaking out of eight months of consolidation within a symmetrical triangle pattern, the daily bar chart pattern of Nifty quickly pulled back to the top of the triangle. Such pullbacks are quite common and provide entry opportunities for those who may have missed the break out.

Technical indicators are bullish, but three of them (MACD, RSI, slow stochastic) touched lower tops while the Nifty touched a higher top. The negative divergences may drop the Nifty back inside the triangle. The break out above the triangle wasn’t accompanied by significantly higher volumes – raising questions about the validity of the break out.

All three EMAs are rising and the Nifty is trading above them. Technically, Nifty has re-entered bull territory. A cross above the Feb ‘12 top of 5630 will put the bulls back in control. Bears will not give up without a fight. There may be some consolidation before the Nifty moves up to test its Feb ‘12 top.

Bottomline? Chart patterns of BSE Sensex and NSE Nifty 50 indices have broken upwards from prolonged consolidation within symmetrical triangles. Though the break outs haven’t been strong, such break outs after long consolidations are often followed by strong up moves that can take the indices close to their Nov ‘10 peaks. The bear market may be finally getting over.

Thursday, August 9, 2012

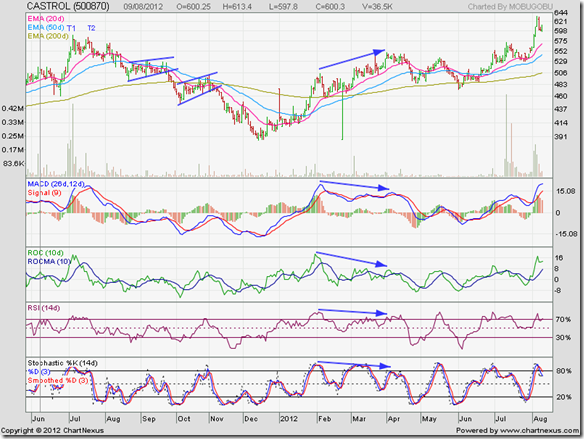
Stock Chart Pattern - Castrol India (an update)

In the previous update (on Jun 8 ‘11 – marked by grey vertical line on the left of the chart below) to the stock chart pattern of Castrol India, the following were the concluding remarks:”Like Colgate, this stock can be added at any price, and most definitely on dips and corrections.”

The daily bar chart pattern of Castrol India shows the wonderful buying opportunity the stock provided by dropping to a low of 385 in Dec ‘11:

Castrol_Aug0912

Note the small double-top reversal pattern (labelled T1 and T2) formed back in Jul ‘11 – about a month after my previous post – which marked the end of the 200+ points intermediate rally from the low of 380 touched on Feb 28 ‘11 (not shown in chart). The volume bar on Jul 5 ‘11 during the first top (T1) was much taller than the volume bar on Jul 18 ‘11 during the second top (T2). This satisfied the first condition of a double-top. Once the price dropped below 544 – the ‘valley’ point between the two tops – the second condition for a ‘double-top’ got confirmed. That was the first signal to book profits.

It is not easy to follow these technical signals while they occur. However, after dropping below the 20 day EMA, the stock price bounced up on good volume support to touch a lower top of 569 on Aug 4 ‘11. That gave a stronger signal to book profits. The stock gave additional profit booking opportunities by consolidating within, and breaking down from, two ‘rising wedge’ patterns.

The stock finally stopped falling after touching a slightly higher bottom of 385 in Dec ‘11 (the previous bottom of 380 was touched in Feb ‘11). The subsequent rally initially coincided with the rally in the broader markets, before the stock continued its upward march by forming a bullish pattern of higher tops and higher bottoms. The spike in volumes as the stock crossed its 50 day EMA and 200 day EMA, followed by a pullback to, and upward bounce from, the 200 day EMA provided buying opportunities.

The ‘golden cross’ of the 50 day EMA above the 200 day EMA technically confirmed a return to a bull market. As the stock price rose to touch a higher top in Apr ‘12, all four technical indicators touched lower tops (marked by blue arrows). The combined negative divergences led to a correction and the stock briefly dropped below its 200 day EMA – giving no returns for the 12 months period from the previous post on Jun 8 ‘11.

However, partial profit booking in Aug and Sep ‘11 and buying back in Dec ‘11 and Jan ‘12 would have given decent returns. Such a strategy may not work with every stock, and should not be tried by small investors. But when the stock is a Colgate or a Castrol, then partial profit booking and buying back at lower prices is a great way to enhance returns.

The recent high volume price spike has been due to the announcement of another 1:1 bonus issue in Jul ‘12. The stock price has corrected from an overbought condition after touching an all-time high of 634 on Aug 6 ‘12. The price may correct a bit more, which would be a good opportunity to get in for new investors. A better opportunity may be to wait for a likely price correction after the bonus shares are credited to demat accounts of existing shareholders.

Bottomline? The stock chart pattern of Castrol India took investors on a roller-coaster ride over the past 2 years – swinging between 590 and 380. Those who held on for the ride have been rewarded with two 1:1 bonus share issues - not to forget about the substantial dividends. To build wealth, small investors should concentrate on ‘expensive’ stocks like Castrol and Colgate, instead of chasing after ‘cheap’ mythical multibaggers.

Wednesday, August 8, 2012

Nifty and Defty charts: a mid-week technical update

Nifty chart

Nifty_Aug0812

The daily bar chart pattern of Nifty has broken out above the symmetrical triangle pattern – thanks to relentless buying by FIIs. Of late, the DIIs have joined the bull bandwagon. The index has formed a bullish pattern of higher tops and higher bottoms since touching its Jun ‘12 low.

Both the 20 day and the 50 day EMA have moved above the 200 day EMA. Technically, Nifty is back in bull territory. Volumes have been rising for the past few days. Technical indicators are also looking bullish. So, is the bear market finally over?

For the bulls to regain control, Nifty has to cross convincingly above its Feb ‘12 top of 5630 – which is almost 300 points (more than 5%) higher than today’s closing level of 5338. That may not appear to be too difficult a task, but first the index has to overcome some rough terrain.

Today’s trading bar shows a close very near the lowest level of the day (5331). Combined with the high volume, it becomes a ‘distribution day’ that may end the rally. All four technical indicators are showing negative divergences – MACD and RSI have touched lower tops while ROC and slow stochastic have touched their previous tops.

A likely pullback to the top edge of the triangle, if followed by an upward bounce, will be a buying opportunity. But a pullback inside the triangle may prolong the sideways consolidation.

Defty chart

S&P CNX Defty_Aug0812

Despite heavy buying by FIIs, Defty’s one year bar chart pattern still looks bearish. The index just about managed to reach its Jul 4 ‘12 top of 3391, but is still trading below its falling 200 day EMA. The 50 day EMA is well below the 200 day EMA – a sign of a bear market.

All four technical indicators are showing negative divergences by reaching lower tops. Today’s high volume ‘distribution day’ bar may end the rally. A convincing break out above the 200 day EMA will be the first real bullish sign. A move above the Feb ‘12 top of 3967 will put the bulls back on top.

Fundamentally, things are not getting better. In fact, they may be getting worse. GDP growth is slowing down. Drought-like conditions in many parts of the country will fuel food price inflation, and force the RBI’s hand in keeping the high interest rates intact. Oil price is going up and exports are going down – worsening the balance of payments situation. Positive statements from the Finance Minister hasn’t translated into any policy action as yet.

So, why are the indices moving up? Because the economic situation is expected to get better after 6 months, and stock markets tend to ‘discount’ positive news in advance. Will the economic situation in India – and globally – get better in the next 6 months? Some one can get seriously rich if she knows the answer to that question!

Tuesday, August 7, 2012

WTI and Brent Crude Oil charts: bulls fight back strongly

WTI Crude chart

WTI Crude_Aug0712

In an update three weeks ago about WTI Crude Oil’s 6 months daily bar chart pattern, bullish technical indicators had suggested the possibility of the bear market rally continuing a bit longer. But sliding volumes raised questions about the rally’s sustainability.

It wasn’t a great surprise that the rally stalled just short of the falling 200 day EMA. Oil’s price dropped to its 50 day EMA, consolidated sideways for a few days before making another attempt to test and cross above the 200 day EMA. Will the bulls succeed this time?

Technical indicators are looking bullish. Both RSI and slow stochastic are above their 50% levels. MACD is positive and above its signal line. But there are signs of weakness in momentum. Note that oil’s price touched a slightly higher bottom on Thurs. Aug 2 ‘12, but all three technical indicators touched lower bottoms. Also, down day volumes are strong – which means bears are using every opportunity to sell.

The 20 day EMA has moved up to touch the 50 day EMA, but both remain below the 200 day EMA. Technically, WTI Crude Oil remains in a bear market. Even if oil’s price manages to cross above its 200 day EMA, it is likely to face renewed selling pressure.

Brent Crude chart

BrentCrude_Aug0712_weekly

The following concluding remarks were made three week’s back about the 2 years weekly closing chart pattern of Brent Crude Oil: “Technically, Brent Crude oil is in a long-term bull market. Bulls may regain control if oil’s price can climb above its 50 week EMA. Bears are unlikely to yield ground without a fight.”

Note that oil’s price hesitated briefly near its 20 week EMA, before rising sharply to cross above its 50 week EMA. Are the bulls back in control? Yes, and no. Oil’s price is trading above all three EMAs and the 200 week EMA is rising. That means the long term bull market is intact.

But the cross above the 50 week EMA hasn’t been a convincing one yet. Also, the entire rally from the Jun ‘12 low has been accompanied by sliding volumes – which means the rally can stall at any time.

Technical indicators are looking bullish. RSI is just above its 50% level, but its upward momentum is not strong. MACD has crossed above its signal line, but is in negative territory. Slow stochastic has climbed smartly above its 50% level.

The current rally has retraced about 50% of oil’s fall from its Mar ‘12 double-top to its Jun ‘12 bottom. In the daily closing chart of Brent Crude Oil (not shown), negative divergences are visible in RSI and slow stochastic, which failed to rise higher with oil’s price. Beware of lurking bears.

Monday, August 6, 2012

Stock Index Chart Patterns: S&P 500 and FTSE 100 – Aug 03, ‘12

S&P 500 Index Chart

SnP500_Aug0312

The 6 months daily closing chart pattern of the S&P 500 index is zig-zagging its way higher from its Jun ‘12 low, despite determined attempts by the bears to stall the rally. All three EMAs are rising and the index is trading above the EMAs. The bulls are back in control, or are they?

The index is trading well above its 20 day EMA, which in turn is trading high above its 200 day EMA. Expect some more zig-zag moves, as the bears may attack at any time. The index is approaching previous tops of Apr and May ‘12 – which can attract profit booking. Volumes have remained high on down days, which is a concern.

Technical indicators are bullish. RSI is above its 50% level, and rising. MACD is moving up in positive territory above its signal line. Slow stochastic is alternately entering its overbought zone and falling below its 50% level. Note that RSI and slow stochastic are showing negative divergences by touching flat or lower tops as the index has climbed higher.

S&P 500 has provided great trading opportunities in the last 2 months, but long-term investors may have spent a few sleepless nights. Hold on, and enjoy the ride while it lasts.

FTSE 100 Index Chart

FTSE_Aug0312

The 6 months daily closing chart of the FTSE 100 index is trying to emulate the S&P 500 index by zig-zagging its way into bull territory despite a perceptible slow down in the UK economy. Just goes to show that the stock market doesn’t always follow logic.

The 20 day EMA has crossed above the 200 day EMA. The 50 day EMA may do so soon. The ‘golden cross’ will confirm a return to a bull market. All three technical indicators are bullish, but showing negative divergences by failing to reach higher tops with the index. Expect a correction in the near term, as the index is approaching its Apr and May ‘12 tops.

Bottomline? Chart patterns of the S&P 500 and FTSE 100 indices are forming bullish patterns of higher bottoms and higher tops. The bearish ‘rising wedges’ observed two weeks back appear to have been negated. Both indices are near previous tops, which could lead to profit booking. Both the US and UK economies are slowing down. It may be better to be cautious and safe than be bullish and sorry.

Sunday, August 5, 2012

Notes from the USA (Aug 2012) – a guest post

In a guest post in Feb ‘12, KKP had presented a Consumer Survey Report from ChangeWave. US consumer spending was increasing then. Consumer confidence and expectations had shown improvement for the 6th straight month.

The improvement in the US economy hasn’t quite progressed according to plan. In fact, it has taken a turn for the worse. In his July 2012 guest post, KKP had introduced two less known indicators to suggest that the US economy was slowing down. The latest survey report from ChangeWave confirms the slow down.

-------------------------------------------------------------------------------------------------------------------------------------

Time and Expectations

Time is fundamental to every strategy for investors and traders. In the markets today, time has become incredibly compressed by the “black hole” of technology and media – causing investors to often think and act in seconds and minutes rather than days and months. This state of affairs surely affects investor psychology in many ways, both good and bad.

ChangeWave’s weekly surveys contribute to a larger mosaic that in combination informs us of the dynamics of the US economy, specific sectors, and major corporations. The data is a snapshot in time, revealing the rate of change and momentum in many critical areas of the economy and its sectors. They also provide the context in which I evaluate all other data and events.

One thing that investors continue to ignore at their own peril is that the global and US economies are experiencing a massive, long-term process of balance-sheet deleveraging. This reflects both excessive consumer debt – as well as huge public sector issues – and the effects are particularly telling in ChangeWave’s consumer surveys. With such constraints on spending, any recovery will struggle to sustain 3.5% growth or better.

The Dow has climbed back above 13,000 on the wide belief that the economy is just lousy enough to prompt Ben Bernanke to initiate another round of quantitative easing and/or some other action to lift the economy or investor spirits. If the economic outlook is more dire than “just lousy enough,” then the US Federal Reserve will be even more limited in effectiveness.

The markets have learned something about Bernanke’s view on the economy and his likely intentions. Bernanke’s counterpart across the pond, European Central Bank chief Mario Draghi, last week vowed to do whatever it takes – assuring that it will be enough. Equity markets reacted very favorably to Draghi’s remarks, which may have set the tone for the U.S. chief.

Of course, reactions to the comments and actions by the central bankers will vary widely depending on one’s time frame and expectations.

Top and Bottom Lines

In April and May, ChangeWave’s consumer surveys indicated without a doubt that the US economy was losing momentum. Subsequent surveys on both the consumer and business sides revealed that the slowdown was taking root. The sideways direction for most of the economy has characterized the recovery since 2010, and it will take much more than the Fed to break this pattern.

Going back as far as Q4 2011, Wall Street analysts’ estimates were on the whole overly optimistic in their projections of corporate revenue and earnings. As we’ve seen since early 2012, analysts have repeatedly stumbled over each other to cut estimates as companies continue to offer downward guidance.

For the current season, after all the adjusted estimates, about 70% of the companies that reported earnings so far have beaten expectations. Yet a troubling 65% have missed the top line on sales. The latter is the result of the strain on demand as ChangeWave’s data has so well illustrated. Unfortunately, there is still relatively little being done to address the weakness in consumer spending.

Despite the lagging top line, investors have been bidding up stock prices. In fact, “the average stock that has reported since earnings season began on July 10th has gained 0.70% on its report day,” according to Bespoke Investment Group. “If the season were to end today, this would be the best performance stocks have seen on their report days since Q4 2010.”

It appears The Street had already lowered expectations enough that the numbers reported were viewed as fairly positive. During the same period last year, when the economic outlook was equally tepid, the average stock fell nearly 2% on its report day.

Now let’s delve into a few more highlights from ChangeWave’s latest consumer spending survey to identify some areas of strength and weakness.

Consumer Bellwethers Lose Momentum

ChangeWave’s July ‘12 consumer survey recorded the third consecutive monthly decline in consumer spending behavior. It also registered a significant decline in spending growth. Thus, it was no surprise when the government reported last week that in Q2 2012 US GDP grew at its slowest pace in a year – rising 1.5% after a revised 2% gain in the prior quarter.

The survey also reveals multiple categories being affected by the current spending slowdown, including restaurants, household repairs, electronics and durable goods. Even discount retailers like Target (TGT), Costco (COST) and Walmart (WMT) are feeling the effects.

During this earnings season, the results of several US retail bellwethers reflect the consumer trends identified by ChangeWave in recent months:

  • Slowing sales in part led Procter & Gamble (PG) to cut profit forecasts three times this year.
  • UPS (UPS), the world’s largest package-delivery company, cut its full-year profit forecast after a drop in Q2 international package sales. The company projects the US will grow 1% in the remainder of 2012.
  • McDonald’s (MCD), Starbucks (SBUX) and Chipotle (CMG), which are typically resilient during tough economic times, saw a bit of a slowdown in US guest-count growth in Q2.

Starbucks’ CEO said he’s been speaking with other heads of consumer companies, and most everyone saw a similar pattern of deceleration in June and July, according to Bloomberg. “So, this is not a Starbucks issue, this is a macro problem.”

Coach (COH), the largest US luxury handbag maker, reported quarterly revenue that trailed analysts’ estimates. Sales at North American stores open at least a year rose 1.7%, compared with a gain of 10% a year earlier.

Easing Pressures

ChangeWave’s July ‘12 consumer survey showed a modest improvement in consumer expectations and confidence and signs that lower gas prices may be lifting spending in other areas. The findings even uncovered easing job concerns, a strong indicator that corporations, while not yet aggressively hiring, have tempered layoffs, downsizing and other cutbacks.

When asked how much they worry about someone in their family losing their job, 28% reported they worry A Great Deal (8%) or Quite a Bit (20%), while 28% said they Do Not Worry at All – a net 9 points better than previously.

job_loss

Even though Reduced Income (36%) remains the number one reason why consumers are spending less, it declined 4 points in July ‘12 to its second lowest level of the past two years.

Overall, ChangeWave’s latest consumer survey indicates that the sideways movement of the economy is entrenched and shows no signs of breaking out to either the downside (i.e. recession) or upside (i.e. robust recovery). Of course, we’ll continue to monitor consumer spending and behavior and you’ll be the first to know when the US economy finally breaks out.

-------------------------------------------------------------------------------------------------------------------------------------

KKP (Kiran Patel) is a long time investor in the US, investing in US, Indian and Chinese markets for the last 25 years. Investing is a passion, and most recently he has ventured into real estate in the US and also a bit in India. Running user groups, teaching kids at local high school, moderating a group in the US and running Investment Clubs are his current hobbies. He also works full time for a Fortune 100 corporation.

Saturday, August 4, 2012

BSE Sensex and NSE Nifty 50 index chart patterns – Aug 03, 2012

BSE Sensex index chart

FII buying, particularly during the early part of the week, pushed Sensex above all its three EMAs and into bull territory. DII selling ensured that the rally didn’t progress too far. Slim hopes of an interest rate cut by the RBI were belied. The market seemed to have discounted the possibility in advance.

The index is consolidating within a large ‘symmetrical triangle’ pattern. Since the triangle has been tested twice on the upper side and twice on the lower side, a break out may happen soon. Triangles are unreliable about the direction of the eventual break out. An upward break out should be supported by a significant increase in volumes. A downward break out does not require volume support.

All three EMAs are beginning to converge together. A sharp move could follow. Will the index move upwards and break out above the triangle, or will it move downwards? Since Sensex is in a bear market, the move is expected to be downwards. But it is better to wait for the actual move instead of trying to outguess it.

SENSEX_Aug0312

The one year daily closing chart of the Sensex shows that the 200 day EMA is almost flat and moving sideways – indicating that bulls and bears are almost equally matched. Remember that it isn’t necessary for an index or a stock to break out above or below a triangle – though a break out is a logical outcome. Some times, an index (or stock) may move sideways right through the apex of a symmetrical triangle – thereby negating the pattern.

Technical indictors are mildly bullish. MACD is touching its signal line, and both are just inside positive territory. ROC is barely positive, but above its 10 day MA. RSI is slightly above its 50% level. Slow stochastic has entered its overbought zone, but showing signs of turning down. The brief rally may be petering out.

NSE Nifty 50 index chart

A weak monsoon is threatening drought-like conditions in many parts of the country. In anticipation, some states have already started clamouring for central assistance. A drought will further dent the prospects of economic growth and lead to a spike in food inflation.
As if that isn’t bad enough, oil prices have started rising again – putting further stress on India’s balance of payments problems. With exports slowing down perceptibly, don’t expect depreciation of the Rupee to reverse direction any time soon. It will take a long while before India can dig itself out of the current economic morass.

Nifty_Aug0312 

The weekly closing chart of the Nifty 50 index has been consolidating within a symmetrical triangle pattern since touching its Dec ‘11 low. Last week, the index closed above its 20 week and 50 week EMAs after three straight weeks of lower closes. But have a look at the volume bars. This week’s volumes were less than the previous down week’s volumes. A rally needs volume support, without which it may not sustain very long.

Weekly technical indicators are looking bullish. MACD is above its signal line and just about positive. ROC is rising above its 10 week MA in positive territory. RSI is trying to move above its 50% level once again. Slow stochastic has moved down from its overbought zone.

Bottomline? Chart patterns of BSE Sensex and NSE Nifty 50 indices are consolidating within large symmetrical triangle patterns. Break outs may happen in either direction from such patterns. It may be better to wait for the break out before plunging in feet first. India’s economy is in a period of declining growth and rising inflation – a double whammy that may lead to stagflation. Stock markets don’t thrive in such a situation. It is advisable to concentrate on less risky investment avenues.