Tuesday, November 26, 2013

WTI and Brent Crude Oil charts: an update

WTI Crude chart

WTI Crude_Nov2513

The 6 months daily bar chart pattern of WTI Crude oil is down in a bear market, and there are signs that oil’s price may fall lower. The 50 day EMA formed a bearish ‘rounding top’ pattern since Jul ‘13, and its ‘death cross’ below the 200 day EMA has technically confirmed a bear market.

Oil’s price has been consolidating sideways between 92 and 96 for the past 3 weeks. The falling 20 day EMA has thwarted attempts at up moves. Strong volumes on down days show that bears continue to be active. A drop to 85 is a possibility.

Daily technical indicators are giving mixed signals, which is often the case during periods of consolidation. MACD is rising above its signal line, but remains negative. Note that the signal line appears to be forming a saucer-like pattern, which has bullish implications.

RSI has turned down after failing to reach its 50% level. Slow stochastic moved up sharply above its 50% level, but its upward momentum is slowing. Attempts at an up move may attract more bear selling.

Brent Crude chart

Brent Crude_Nov2513

The 6 months daily bar chart pattern of Brent Crude oil started a spirited rally just when it looked like bears were getting the upper hand. However, the rally seems to have stalled near the 112 level (the previous top touched in Oct ‘13).

Part resolution of nuclear talks with Iran, followed by lifting of some of the economic sanctions including oil sales, spooked the bulls. Oil’s price dropped to 108 before recovering to close at 111 – in bull territory. The ‘death cross’ has been avoided – at least for now.

Daily technical indicators are looking bullish, and showing positive divergences by touching slightly higher tops than the ones touched in Oct ‘13. Oil’s price may try to cross above 112. However, once Iranian oil reaches full production and starts flowing into world markets, Brent Crude prices should start sliding.

Monday, November 25, 2013

Stock Index Chart Patterns: S&P 500 and FTSE 100 – Nov 22, ‘13

S&P 500 Index Chart

S&P 500_Nov2213

The 6 months daily bar chart pattern of S&P 500 index is showing good news and some bad news. First, the obvious good news. The index had a brief correction during the first three days of the week and then zoomed up to close above the 1800 level at a new lifetime high.

Now, the bad news. Volumes are gradually falling as the index is moving higher. All three daily technical indicators are looking overbought and showing negative divergences by failing to touch new highs. Most worrisome is the bearish ‘rising wedge’ pattern which the index is forming since the last week of Oct ‘13.

The index is showing signs of overheating. Before it lets off some serious steam, it may be a good idea to book partial profits.

Economic news continues to be encouraging, with retail sales growing, initial claims of unemployment falling and manufacturing index rising. But the housing market remains a concern.

FTSE 100 Index Chart

FTSE_Nov2213

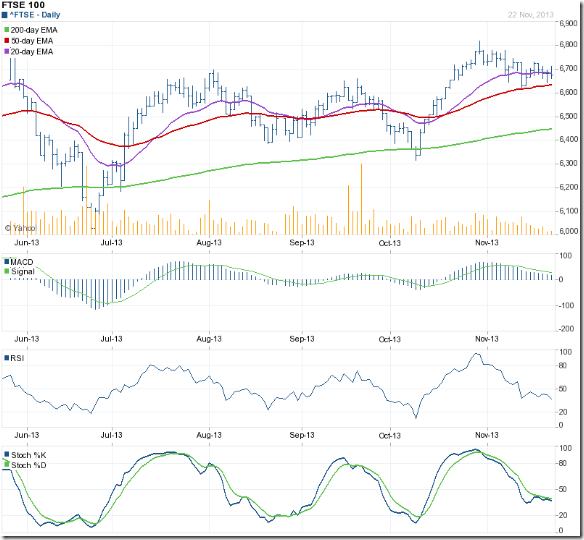
The 6 months daily bar chart pattern of FTSE 100 index consolidated sideways during the week and closed below the 6700 level. Though the index is in a bull market, the down trend that started from the Oct ‘13 top of 6820 is still ongoing.

The good news is that the index has not dropped below its 50 day EMA during Nov ‘13. The bad news is that the three daily technical indicators are turning bearish. The bulls may not be able to prevent a breach of the 50 day EMA.

MACD is falling below its signal line, and may soon enter negative territory. Both RSI and Slow stochastic are below their 50% levels and look ready to fall further. At the time of writing this post, the index is trying hard to move above the 6700 level.

Bottomline? 6 months daily bar chart patterns of S&P 500 closed at a new life-time high. Some partial profit booking may not be a bad idea. FTSE 100 is trying to recover from a bull market correction. Stay invested but maintain a stop-loss.

Sunday, November 24, 2013

BSE Sensex and NSE Nifty 50 index chart patterns – Nov 22, 2013

Bears continued their domination (i.e. DIIs continued to sell). Even FIIs turned net sellers during the last two days of the week. Both Sensex and Nifty indices had lower weekly closes despite some early flourish.

The spectre of US Fed tapering its QE3 bond buying apparently spooked the market. There is also some concern that NaMo has overplayed his hand and his constant personal attacks on Congress leaders is starting to create a negative impression among older voters.

‘Third front’ leaders are trying to band together with the misplaced hope that they may be in a position to form a government if the general elections produce a hung parliament. The more likely outcome is that NDA or UPA may require the third front’s support to form a government. Neither of the two options will enthuse the market.

Hopefully, the economy will start to turn around by Q4 ‘13 and company performances will improve. That will let the stock market take election results in its stride.

BSE Sensex index chart

SENSEX_Nov2213

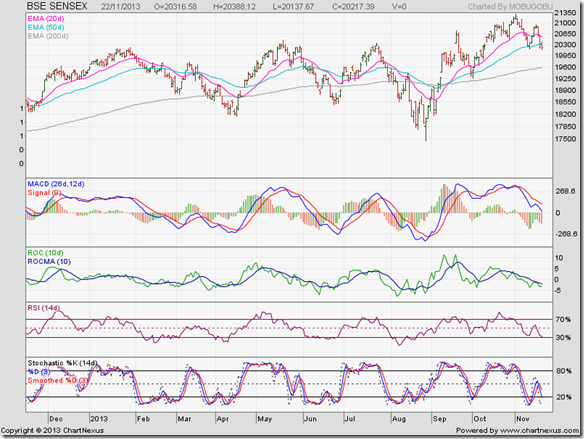
The daily bar chart pattern of Sensex closed below its 50 day EMA for the first time in more than 2 months. A test of support from its rising 200 day EMA seems likely. Can the index drop below its 200 day EMA – like it did back in Aug ‘13.

Daily technical indicators don’t seem to suggest so. MACD is about to drop into negative territory. But the other three – ROC, RSI, Slow stochastic - are not only in bearish zones but are looking oversold. Buying interest may emerge as the index drops near its 200 day EMA.

At times like these, small investors are consumed by fear and stay out. To make money, one needs to be a contrarian. That means welcoming such opportunities to buy. The index is correcting after touching an all-time high. The next rally is likely to go higher.

NSE Nifty 50 index chart

Nifty_Nov2213

The weekly bar chart pattern of Nifty closed lower for the third week in a row. Bulls may point out that the 20 week EMA is providing good support. But that support may get breached next week. Why?

The weekly technical indicators are beginning to turn bearish. MACD is positive, but moving down towards its signal line. ROC has crossed below its 10 week MA, and looks ready to drop into negative territory. RSI is just below its overbought zone, but its upward momentum has dissipated. Slow stochastic has slipped down from its overbought zone.

A drop to the 50 week EMA is a possibility. Note that as long as the long-term up trend line (in blue) is not breached on a closing basis, there is no need to worry for the bulls.

Bottomline? Chart patterns of BSE Sensex and NSE Nifty indices are in corrective modes for the third straight week after touching life-time highs. This is a good time to study fundamentally strong mid-cap and small-cap stocks that are available at reasonable valuations. The correction is providing an opportunity to accumulate them gradually.

(Note: If you wish to learn more about fundamentally strong mid-cap and small-cap stocks, become a paid subscriber of my Monthly Investment Newsletter. A limited number of new subscriptions will be offered during Jan. 2014. Contact me for details: mobugobu@yahoo.com)

Friday, November 22, 2013

Are sugar stocks turning bitter already?

Blog readers may be aware that my opinion of the sugar sector (expressed here and here) is not good. The reason is simple – too much government control over policy and price. So why am I writing about the sector? To sound a warning note.

For the past couple of months, there have been some indication that sugar stocks have bottomed out after a prolonged bear period. That has attracted many small investors who are forever looking at ‘cheap’ stocks on which they can turn a quick profit.

The recovery in sugar stocks was mainly on the hope of some price rationalisation by the government to help out the struggling(?) sugar companies. The government did announce revised prices of procuring sugar cane from farmers, but it was much higher than what the sugar companies are willing to pay and much lower than what farmers are demanding.

The farmers are unhappy. So are the sugar producers. If you entered at lower levels, take your profits and be happy. Things may get worse.

Bajaj Hindusthan

BajHind

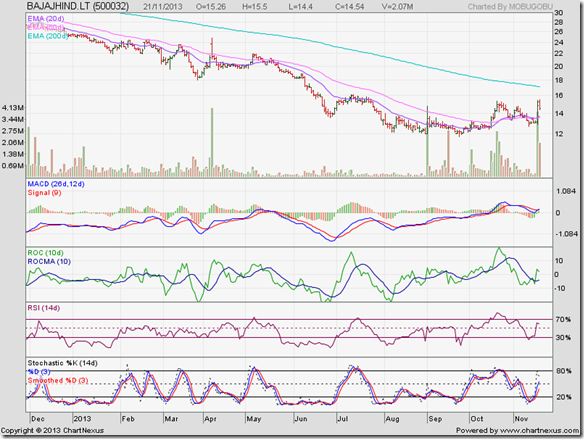
The stock price recently spurted higher on strong volumes, but failed to reach its falling 200 day EMA. All four technical indicators indicated negative divergences by failing to move up higher. Bears are likely to resume their dominance.

Balrampur Chini

BalramChini

If you are interested in buying a sugar stock, Balrampur Chini may be your best bet. The stock is in an up trend since Aug ‘13, forming a bullish pattern of higher tops and higher bottoms. The stock price is pulling back towards its 200 day EMA, after crossing above it on strong volumes. Buy only if the stock bounces up from its 200 day EMA.

Dalmia Sugar

DalmiaSug

After a prolonged consolidation in a bullish ‘rounding bottom’ pattern, Dalmia Sugar traded above its 200 day EMA during Oct ‘13. It has since formed a bearish ‘rounding top’ pattern to drop below its long-term moving average. Technical indicators are recovering from oversold conditions. The stock may try to resume its up move.

Dhampur Sugar

Dhampur

The stock price of Dhampur Sugar formed a ‘double-bottom’ reversal pattern and jumped up to test its falling 200 day EMA on strong volumes; but dropped down after facing strong resistance. ROC and RSI are looking overbought. Bears may use the opportunity to sell.

Dwarikesh Sugar

Dwarikesh

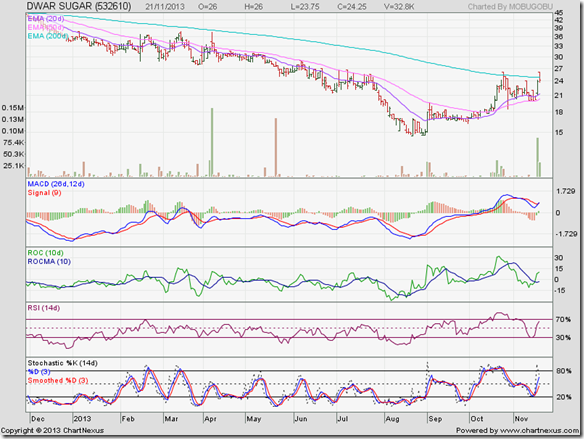
Dwarikesh Sugar stock made a couple of efforts to cross above its 200 day EMA – but failed to close above its long-term moving average. Daily technical indicators are showing negative divergences by touching lower tops. However, the stock is in an up trend, and can be bought with a strict stop-loss at its 50 day EMA.

EID Parry

EID Parry

EID Parry stock is in an up trend, but struggling to cross its 200 day EMA. It is facing strong resistance at 155. Daily technical indicators are showing negative divergences by touching lower tops after reaching their Oct ‘13 highs. Buy only on a convincing move above 155.

Rajshree Sugar

RajshrSug

The stock price of Rajshree Sugar is trying to correct oversold conditions, but is trading below all three EMAs. Avoid.

Shree Renuka Sugar

Renuka

Once a darling of the stock market, Renuka Sugar is struggling to get out of a bear stranglehold. It is consolidating within a symmetrical triangle pattern, from which the likely break out is upwards. Since triangles are unreliable, wait for the break out.

Simbhaoli Sugar

Simbhaoli

Simbhaoli Sugar is sliding deeper into a bear market, with no sign of a bottom formation. Avoid.

Ugar Sugar

UgarSugar

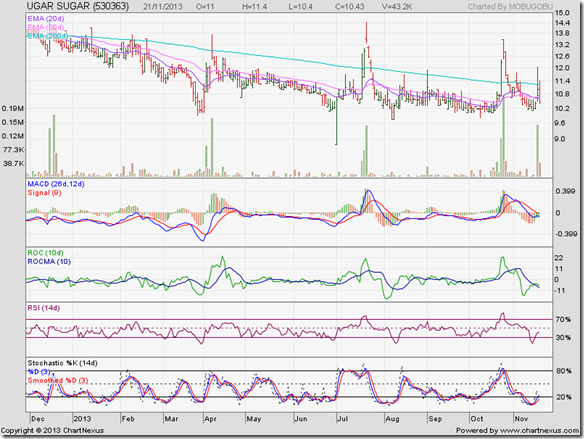
The stock price of Ugar Sugar has attempted to cross above its falling 200 day EMA on five occasions in the past 12 months. Bears have stifled bullish hopes each time. The stock is trying to find a bottom at 10. Avoid.

(Note: I don’t track the sugar sector, and have very little idea of the fundamental strengths or weaknesses of any of the stocks mentioned above.)

Wednesday, November 20, 2013

About US Fed’s QE3 (non)tapering and its effect on our stock market – a guest post

In an effort to kick-start the growth engine of the struggling US economy following a recession, the US Fed (equivalent to India’s RBI) has unleashed a flood of cheap liquidity in a low interest rate regime through its Quantitative Easing programmes.

The hope was that ready availability of money at low interest rate would enable manufacturing and services sectors to expand and create jobs, which in turn would rejuvenate the housing market. Despite three rounds of Quantitative Easing – QE3 is still ongoing – US GDP growth remains in very low single digit.

So, where is all the cheap liquidity going? To global stock markets – boosting stock prices, even as unemployment remains high and the housing market is in doldrums. The patient is ailing but the doctor’s prescription isn’t working. In this months guest post, Nishit explains when to expect QE3 to be wound down and what investors can do to turn a profit in the interim period.

---------------------------------------------------------------------------------------------------------------------------------------

The US Fed has continued with the third round of Quantitative Easing (QE3). This has led to equity markets continuing to rally – boosted by easy and cheap liquidity. Let us try and explore what this QE3 is about and whether it will continue.

The US Fed - to avoid the effects of an economic recession that started in 2008 - keeps buying US Bonds thereby pumping in large sums of money into the economy every month. With prevailing low interest rate, this leads to cheap and easy cash being available to be invested in markets across the world. Interest rates have been artificially kept suppressed near zero.

The Wikipedia definitions are available here:

http://en.wikipedia.org/wiki/Quantitative_easing

Last May, the Fed announced that they were going to go slow on Quantitative Easing. This rang alarm bells across world financial markets as the rally was based more on easy money rather than fundamentals.

The US Debt ceiling crisis due to which the US government locked down for a few days came about in October. Consequently, financial data did not get published for about a month. As the decision to reduce/stop the loose monetary policy was going to be based on financial indicators, it was clear that the decision to reduce/stop buying bonds was going to be pushed back by about 2-3 months.

Ben Bernanke, the US Fed Governor who had taken the call to taper down QE3, is due to retire in January 2014 after about 8 years in the chair. There was speculation about whether he would seek one more term or whether his replacement would be announced. There were multiple names being thrown around and finally Janet Yellen was short listed as the new US Fed Governor to take over from January.

Now, Janet Yellen is a ‘dove’ who is known for not taking aggressive steps. It was widely expected she would be more cautious in stopping the easy monetary policy. At her confirmation hearing, she reiterated that it was necessary to be completely sure that the economy was in very good shape before starting the QE3 taper.

The markets took it as a signal that the loose policy will continue. The emerging markets continued to rally. This sets the base for a November-February rally which will happen if the easing continues.

Of course, a BJP sweep in December State Assembly elections would give the markets a reason to rally. The real underlying reason would be easy money available from the US and elsewhere and reflected in the FII ‘buy’ figures.

So, we should keep an eye on the US Fed, keep booking profits and take the money home. Markets always give a second chance.

---------------------------------------------------------------------------------------------------------------------------------------

(Nishit Vadhavkar is a Quality Manager working at an IT MNC. Deciphering economics, equity markets and piercing the jargon to make it understandable to all is his passion. "We work hard for our money, our money should work even harder for us" is his motto.

Nishit blogs at Money Manthan.)

Tuesday, November 19, 2013

Gold and Silver charts: an update

Gold Chart Pattern

Gold_Nov1813 

The long-term weekly closing chart pattern of gold (above) should clear any lingering doubts about which direction gold’s price is headed. After crossing the 1900 level to touch its life-time peak back in Sep ‘11, gold’s price consolidated in a rectangular band between 1800 and 1550 for the next 18 months.

Rectangular consolidation patterns tend to be continuation patterns, with measuring implications. Since gold’s price dropped into the pattern from above, the eventual break down below 1550 was no surprise. The long duration of consolidation ensured that the down move below the rectangle was fierce.

The minimum downward target of gold was 1300, calculated thus: Height of rectangle = 1800 – 1550 = 250; drop below rectangle = 1550 – 250 = 1300. Note that the Jun ‘13 closing low was almost 100 points lower.

All three weekly technical indicators reached oversold conditions together. The subsequent sharp upward bounce took gold’s price above its falling 20 week EMA, but failed to reach the 200 week EMA (which is the long-term trend decider).

All three weekly EMAs are falling and gold’s price is trading below them. The 50 week EMA, which is only 5 points above the 200 week EMA, will soon cross below it (‘death cross’) and technically confirm what is already apparent from gold’s price chart – a long-term bear market.

Technical indicators are bearish but not oversold – though Slow stochastic has just entered its oversold zone. The Jun ‘13 low is likely to be breached.

(Note: Indian investors who love to invest in gold may want to look at the chart below to find out what kind of a price premium they are paying.)

Silver Chart Pattern

Silver_Nov1813 

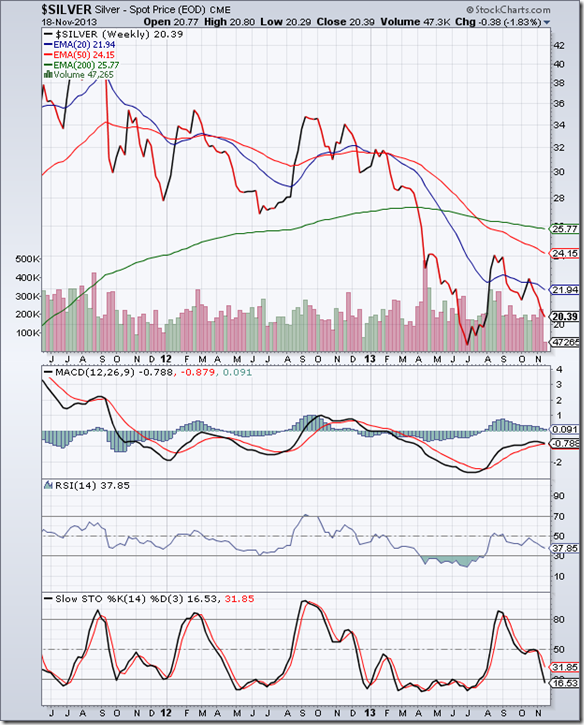
The long-term weekly closing chart pattern of silver followed gold’s price pattern, with one notable exception. The ‘death cross’ of the 50 week EMA below the 200 week EMA occurred 4 months ago. The 200 week EMA has been forming a bearish ‘inverted saucer’ pattern.

Weekly technical indicators corrected oversold conditions but are looking bearish again. The Jun ‘13 low may get breached soon. Silver finds industrial use – unlike gold. The US and Eurozone economies need to show some perceptible growth for silver’s price to regain some of its lost glory.

Monday, November 18, 2013

Stock Index Chart Patterns: S&P 500 and FTSE 100 – Nov 15, ‘13

S&P 500 Index Chart

S&P 500_Nov1513

The 6 months daily bar chart pattern of S&P 500 index received good support from its rising 20 day EMA and soared to a new life-time high. The small double-top reversal pattern at 1775 observed last week was negated. The index stopped just short of the 1800 level.

Volumes were strong as the index touched a new high, but the widening gap between the index and its 200 day EMA is a concern. The index is in uncharted territory, with no known resistance.

Daily technical indicators are bullish but looking overbought. MACD has crossed above its signal line just below its overbought zone. RSI has moved up to the door step of its overbought zone. Slow stochastic is deep inside its overbought zone.

All three indicators are showing negative divergences by failing to touch new highs. A correction or consolidation will be good for the sustenance of the rally.

Initial claims of unemployment rose more than expectation. Trade deficit widened on higher imports and lower exports. Looks like the index was celebrating a likely continuation of QE3.

FTSE 100 Index Chart

FTSE_Nov1513

The 6 months daily bar chart pattern of FTSE 100 dropped below the 6700 level once again, but received good support from its 50 day EMA and bounced up. At the time of writing this post, the index is trading above 6700. The dip provided an adding opportunity.

Daily technical indicators are bearish, but showing signs of turning around. MACD is below its signal line in positive territory, but has stopped falling. RSI has turned up after dropping below its 50% level. Slow stochastic also fell below its 50% level, but is trying to turn up. Volume support will be necessary for the index to climb past the 6800 level.

The UK economy is recovering ever so slowly, but there is hardly any growth in wages. Cost of living is outpacing wage growth.

Bottomline? 6 months daily bar chart patterns of S&P 500 has touched another new life-time high. Stay invested but maintain a trailing stop-loss. FTSE 100 is recovering from a bull market correction. The dip provided an adding opportunity. New highs are expected soon.

Saturday, November 16, 2013

BSE Sensex and NSE Nifty 50 index chart patterns – Nov 15, 2013

Bears dominated during another holiday-shortened trading week. Both WPI and CPI inflation moved up - due mainly to rising food prices despite a good monsoon. The IIP number was disappointing. The Rupee slid down.

There were a couple of reasons why Sensex and Nifty managed to find some support by the end of the week. The RBI Governor made some soothing noises that stabilised the Rupee and the stock market. Good Q2 results from Tata Steel and M&M also helped.

Is the correction over, or can both indices fall some more? For answers to those questions, we need to take a closer look at Sensex and Nifty charts below.

BSE Sensex index chart

Sensex_Nov1513

The daily bar chart pattern of Sensex bounced up after receiving support from its 50 day EMA, but faced resistance from its falling 20 day EMA. A lower weekly close means that bears are still holding the upper hand in the near term.

Daily technical indicators are looking bearish. MACD is positive, but falling rapidly below its signal line. ROC is negative and below its 10 day MA. RSI bounced up from the edge of its oversold zone. Slow stochastic is inside its oversold zone.

FIIs remained net buyers throughout the week, but there were some signs that they were booking profits in index stocks and buying mid-cap stocks. Small investors are wary of the market and pulling out their stock and fund investments at every rise.

Despite all the negative sentiment and index volatility, note that the 200 day EMA has been gradually rising and has gained more than 1500 points in the past 12 months. That is a clear sign of a long-term up trend.

The present correction is an adding opportunity.

NSE Nifty 50 index chart

Nifty_Nov1513

The weekly bar chart pattern of Nifty closed lower for the second week in a row, but received good support from its 20 week EMA. While some more correction can not be ruled out, this is not a time to sell off in panic.

Note that the long-term up-trend line (in dark blue) – drawn by connecting the Dec ‘11 and Jun ‘12 lows – is intact, despite three consecutive intra-week breaches in Aug ‘13. The breaches can be ignored because the index did not close below the up-trend line even for a single week.

Weekly technical indicators are bullish, but correcting overbought conditions. MACD is positive and above its signal line, but is not moving up. ROC has dropped from its overbought zone to touch its rising 10 week MA. RSI is just below the edge of its overbought zone. Slow stochastic is about to drop from its overbought zone.

Bottomline? Chart patterns of BSE Sensex and NSE Nifty indices are still in corrective modes after touching life-time highs. Many fundamentally strong mid-cap and small-cap stocks are available at reasonable valuations. The correction can be used to accumulate them gradually.

(Note: If you are interested to learn more about fundamentally strong mid-cap and small-cap stocks, become a paid subscriber of my Monthly Investment Newsletter. A limited number of new subscriptions will be offered during Jan. 2014.)

Wednesday, November 13, 2013

Nifty chart: a mid-week update (Nov 13, ‘13)

Seven straight down-days on the Nifty chart, and the prophets of doom and gloom have started emerging again. Already levels of 5700 and 5500 are being mentioned.

One die-hard bear went so far as to call the rally during Aug and Sep ‘13 as a bear market rally! When was the last time a bear market rally touched an all-time high?!

Economic data seems to be aiding and abetting the bearishness. The IIP number at 2% was nearly half of the consensus estimate. CPI inflation edged into double digits – thanks to rise in food prices.

Is Nifty ready to fall more? Or, is it likely to turn around soon?

Nifty_Nov1313

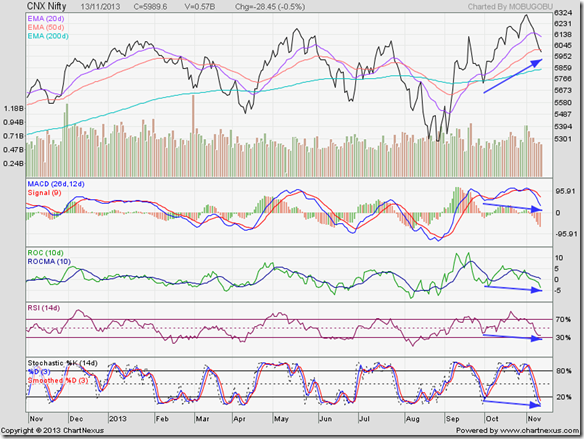
The answer is ‘Yes’ to both those questions. Note the negative divergences in all four technical indicators, which dropped to lower bottoms while Nifty touched a higher bottom (marked by blue arrows). That means the correction isn’t over yet.

However, three of the four indicators – ROC, RSI, Slow stochastic – are beginning to look oversold. That may lead to a bounce back soon. How soon? Perhaps after a test of support from the 200 day EMA.

Can the Nifty fall even lower? It doesn’t appear so – specially with big boys like TISCO and M&M declaring good Q2 results in a slow economy. The Rupee also recovered after its recent fall.

There was profit booking across Asian markets. India was no exception. Renewed fear of US Fed tapering its bond buying programme is the probable cause of nervousness in the market.

Tuesday, November 12, 2013

WTI and Brent Crude Oil charts: back in bear territories

WTI Crude chart

WTI Crude_Nov1213

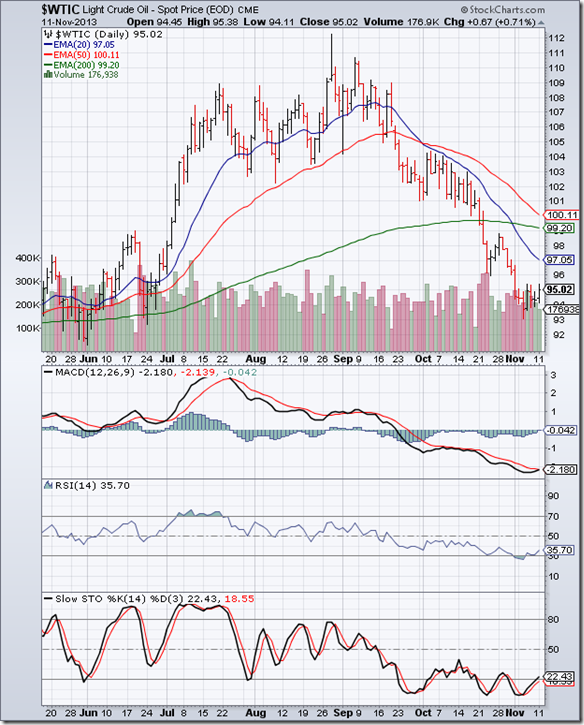
Three weeks back, bearish technical indicators and strong volumes on down days were observed on the daily bar chart pattern of WTI Crude oil. Bears took the opportunity to push oil’s price well below its 200 day EMA.

The 20 day EMA has crossed below the 200 day EMA. The 50 day EMA is about to follow suit. The ‘death cross’ will technically confirm a bear market. Oil is trading below all three EMAs. Volumes continue to be strong on down days. A deeper correction is likely.

Daily technical indicators are correcting oversold conditions, but remain bearish. MACD has moved up a bit to touch its signal line in oversold zone. Both RSI and Slow stochastic are trying to emerge from their respective oversold zones.

A combination of demand slow down and abundant US oil supplies led to a drop in oil’s price. Likely resumption of nuclear talks with Iran may pave the way for rollback of sanctions causing an influx of Iranian oil into world markets – further depressing prices.

Brent Crude chart

BrentCrude_Nov1213

The daily bar chart pattern of Brent Crude oil expectedly dropped below its 200 day EMA, and rallied a bit after receiving support at the 107 level before falling sharply on strong volumes to touch a low of 103. The subsequent upward bounce has temporarily delayed the ‘death cross’ of the 50 day EMA below the 200 day EMA.

Daily technical indicators have corrected oversold conditions, but remain bearish. MACD is turning up inside its oversold zone. RSI bounced up from the edge of its oversold zone. Slow stochastic is emerging from its oversold zone.

Bears are likely to use the bounce to sell. Note that oil’s price has formed a bearish pattern of lower tops and lower bottoms for the past 10 weeks.

Monday, November 11, 2013

Stock Index Chart Patterns: S&P 500 and FTSE 100 – Nov 08, ‘13

S&P 500 Index Chart

S&P 500_Nov0813

The 6 months daily bar chart of S&P 500 formed a small double-top reversal pattern by almost touching the previous all-time high of 1775, and dropped sharply to its rising 20 day EMA. Strong volumes suggested a deeper correction.

Bulls came charging back the next day – thanks to better-than-expected job additions in October despite the government shutdown. The index gained marginally on a weekly closing basis.

Daily technical indicators remain in bullish zones after correcting overbought conditions. However, caution is advised near an all-time high. Also, the index is 240 points above its 200 day EMA – which is often a precursor to a sharp correction.

One needs to respect a reversal pattern. A rise above 1775 will negate the double-top.

FTSE 100 Index Chart

FTSE_Nov0813

The 6 months daily bar chart pattern of FTSE 100 dropped below the 6700 level and its 20 day EMA intra-day, but recovered to close above the 6700 level by the end of the week.

Daily technical indicators have corrected overbought conditions. MACD is touching its signal line in positive territory. Both RSI and Slow stochastic have fallen from their overbought zones. Some more correction is possible.

The dip is providing an adding opportunity.

Bottomline? 6 months daily bar chart patterns of S&P 500 and FTSE 100 indices are undergoing a spot of correction after touching new highs. Bull market corrections provide opportunities to add. But maintain appropriate stop-losses.

Saturday, November 9, 2013

BSE Sensex and NSE Nifty 50 index chart patterns – Nov 08, 2013

After touching lifetime highs, both Sensex and Nifty indices retreated during a Diwali holiday-shortened trading week. Bears (read: DIIs) booked profits. FIIs remained net buyers, but were overwhelmed by the strong volume of DII selling.

Better than expected GDP growth in the USA and Dollar buying by PSU oil firms led to a weaker Rupee. Gold’s price dropped on fears of QE3 tapering sooner than later due to signs of strength in the US economy.

Tech Mahindra and Tata Motors announced strong Q2 results. However, stand-alone numbers of Tata Motors were disastrous. Domestic passenger vehicle and commercial vehicle sales nose-dived. A pick up in CV sales will be an indication of a recovering economy.

BSE Sensex index chart

SENSEX_Nov0813

In last week’s analysis, negative divergences were observed in all four technical indicators and overbought conditions in three of the four indicators led to the following remarks: “A few days of correction/consolidation will remedy the overbought condition and improve the technical ‘health’ of the chart pattern. The likely dip will be another opportunity to add.”

All four technical indicators also formed reversal patterns in their overbought zones, with MACD, ROC and Slow stochastic forming double-tops and RSI forming a head-and-shoulders pattern. So, will all these technical headwinds end the bull market?

The short answer is: No. Bull markets usually end in euphoria, with stock tips flooding the Internet and every one and his brother-in-law buying junk stocks. There is not even an iota of any euphoria. On the contrary, experts have already started predicting much lower levels for the index.

The correction may last a little longer and go a little deeper, but it should remain a bull market correction that is providing an opportunity to add.

NSE Nifty 50 index chart

Nifty_Nov0813

The weekly bar chart pattern of NSE Nifty is in the midst of another bull market correction, but is trading above both its 20 week and 50 week EMAs and the long-term up-trend line (in blue). Such corrections help the index to gather strength for the next up move, and also offer opportunities for adding to existing holdings.

Weekly technical indicators are bullish, but beginning to correct from overbought conditions. Some more correction may be on the cards. Is this a good time to enter the market for new investors?

A good time to enter the market is when you have the money. Index level wise, Jun ‘12 and Aug ‘13 were better times to enter. But one needs courage, conviction and experience to buy during sharp dips.

Note that the up-trend is almost 2 years old. Low-hanging fruits have already been plucked. Most new investors would be better off regularly investing a part of their monthly savings in a recurring deposit scheme and a part in a balanced fund. Gain experience and knowledge before jumping into the stock market.

Bottomline? Chart patterns of BSE Sensex and NSE Nifty indices are in corrective modes after touching life-time highs. Many fundamentally strong mid-cap and small-cap stocks are still available at reasonable valuations – provided one takes a longer-term view of the market. Such stocks can be accumulated gradually.

(Note: If you are interested to learn more about fundamentally strong mid-cap and small-cap stocks, become a paid subscriber of my Monthly Investment Newsletter. A limited number of new subscriptions will be offered during Jan. 2014.)

Tuesday, November 5, 2013

Gold and Silver charts: bear market rallies flatter to deceive

Gold Chart Pattern

Gold_Nov0413

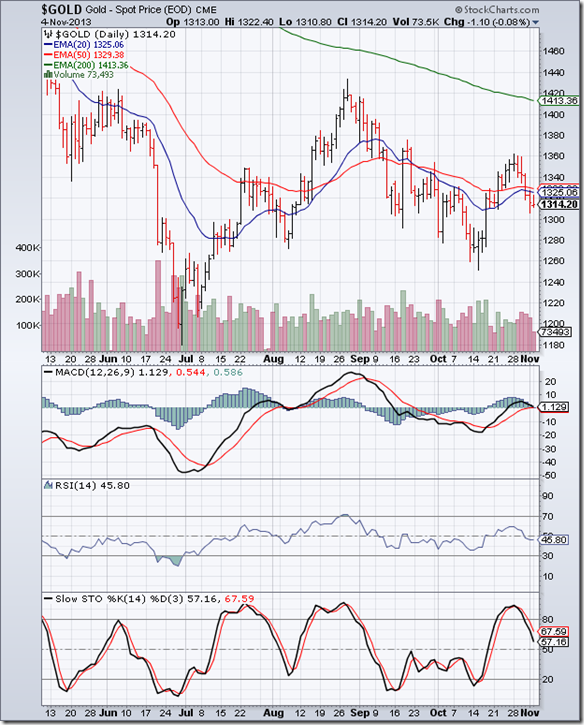
The following comments were made in an analysis of the daily bar chart pattern of gold three weeks back: “The only silver lining for bulls is that gold’s price appears to be trading within a ‘falling wedge’ pattern, from which an upward break out is likely.”

The upward break out from the ‘falling wedge’ did occur on Oct 17 ‘13. Trading volumes were strong, but after rising above its 50 day EMA the rally petered out at 1360 as volumes seemed to dry up.

Volumes picked up again as bears pressed sales, and gold’s price dropped below its 50 day and 20 day EMAs. The falling 200 day EMA wasn’t even tested during the brief rally, which barely lasted two weeks.

Daily technical indicators are turning bearish. MACD is barely positive, and has moved down to touch its signal line. RSI has slipped below its 50% level. Slow stochastic is falling sharply towards its 50% level.

On longer-term weekly chart (not shown), the 50 week EMA is barely 15 points away from crossing below the 200 week EMA. The ‘death cross’ will technically confirm a long-term bear market.

Silver Chart Pattern

Silver_Nov0413 

The 6 months daily bar chart pattern of silver rallied past its 20 day and 50 day EMAs and briefly crossed the 23 level on intra-day basis. But bullish hopes were belied as bears started to press sales.

The rally was more in sympathy with gold’s rally, as economic growth continued to stagnate in Europe and USA. US Fed’s QE3 tapering programme is off the table for now, and the brief surge in price of precious metals has come to an end.

Daily technical indicators are looking bearish. MACD has crossed below its signal line and is about to enter negative territory. Both RSI and Slow stochastic have dropped below their respective 50% levels.

On longer-term weekly chart (not shown), the 50 week EMA has been falling below the 200 week EMA for the past three months. A long-term bear market is unfolding.

Monday, November 4, 2013

Stock Index Chart Patterns: S&P 500 and FTSE 100 – Nov 01, ‘13

S&P 500 Index Chart

S&P 500_Nov0113

The daily bar chart pattern of S&P 500 index rose to touch a new life-time high of 1775 on Oct 30 ‘13, but formed a ‘reversal day’ pattern (higher high, lower close) that ended the Oct ‘13 leg of the up move. In last week’s analysis, negative divergences were observed in all three technical indicators - which warned of an impending correction.

Volumes during the week were highest on Oct 31, which was a down-day – but the index recovered to close marginally higher on a weekly basis. Periodic profit booking has helped to improve the technical ‘health’ of the chart – allowing it to touch new life-time highs on a regular basis.

Daily technical indicators are correcting overbought conditions, but remain bullish. MACD is about to drop from its overbought zone. RSI has moved down after touching the edge of its overbought zone. Slow stochastic has formed a small double-top reversal pattern, and looks ready to fall from its overbought zone.

The correction may continue a bit longer, but there is no threat to the bull market. Note the bullish pattern of higher tops and higher bottoms and a rising 200 day EMA during the past year. Maintain a trailing stop-loss and ride the bull. Dips can be used to add to existing positions.

The economy continues to muddle along – initial unemployment claims fell below the 350,000 mark but job growth remains slow; ISM’s manufacturing index rose marginally; housing and automotive sectors are weak. The QE3 tapering plan may be kept in abeyance for a while.

FTSE 100 Index Chart

FTSE_Nov0113

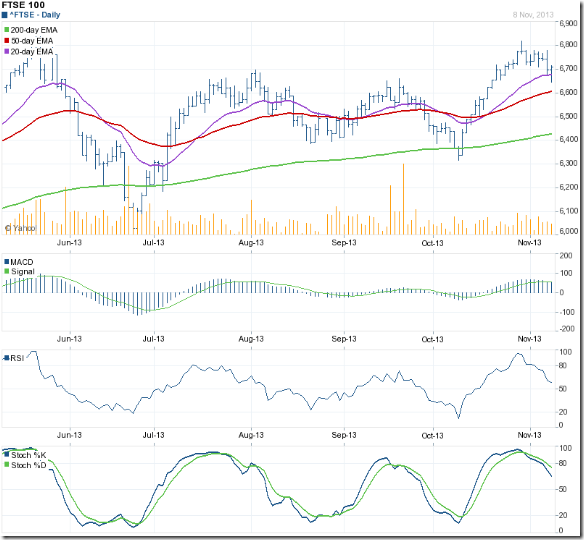
The 1 yr daily bar chart pattern of FTSE 100 rose past the 6800 level to touch a 5 months high of 6820 before undergoing a bout of profit booking. The index still managed to close marginally higher on a weekly basis. The correction should help the index to gather strength and cross its 52 week high of 6876 touched on May 22 ‘13.

All three EMAs are rising and the index is trading above them – which is the sign of a bull market. Note that the 200 day EMA has been rising during the past year, and the index has mostly traded above it – except for brief spells in Jun and Oct.

Daily technical indicators are bullish, but correcting overbought conditions. MACD has stopped rising, but remains above its signal line in positive territory. Both RSI and Slow stochastic are about to drop from their respective overbought zones. The ensuing dip can be used to add to existing holdings.

Bottomline? 1 yr daily bar chart patterns of S&P 500 and FTSE 100 indices are undergoing a bit of profit booking after touching new highs. The long-term bull markets are intact. Stay invested, or use the dips to add to previous holdings.

Saturday, November 2, 2013

BSE Sensex and NSE Nifty 50 index chart patterns – Nov 01, 2013

On the last trading day before Diwali, the inevitable happened. Sensex soared to touch life-time intra-day and closing highs. While Nifty may have missed all-time intra-day and closing highs by the smallest of margins, it did touch a life-time monthly closing high on Oct 31, ‘13.

Strangely, there was very little celebration on Dalal Street. No champagne bottles were popped open, no business TV channel anchor kissed his laptop, and many small investors had glum faces because of reduced Diwali bonuses and decimated stock portfolios.

Is this bull market for real? How can the stock market surge when the economy is doing so poorly? However counterintuitive it may feel, economic growth and stock market performance are inversely correlated. How else can you explain the stellar performance of the S&P 500 index and the dog that the Shanghai Composite has become? 

BSE Sensex index chart

SENSEX_Nov0113

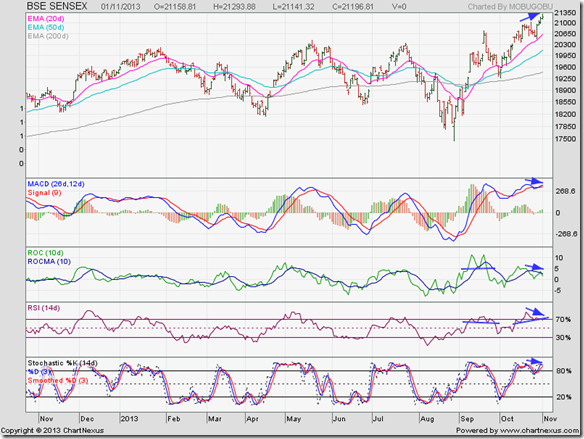
The daily bar chart pattern of BSE Sensex index is soaring upwards, and trading above all three EMAs which are rising together. Bulls (read: FIIs) are clearly in control, but the index is showing signs of a temporary top.

Three of the four technical indicators – MACD, RSI, Slow stochastic – are in their overbought zones, with the RSI forming a small head-and-shoulders reversal pattern. All four indicators are showing negative divergences (marked by blue arrows) by failing to touch new highs with the index.

A few days of correction/consolidation will remedy the overbought condition and improve the technical ‘health’ of the chart pattern. The likely dip will be another opportunity to add.

NSE Nifty 50 index chart

Nifty_Nov0113

A ‘reversal week’ pattern observed in last week’s analysis was ignored by the bulls as the weekly bar chart pattern of NSE Nifty index rose to touch a new 52 week high on intra-day and closing basis. The strong weekly volume bar indicates return of buying interest.

The long-term up-trend line continues its steady rise. All four technical indicators are bullish, with ROC and Slow stochastic inside their overbought zones.A bout of correction or consolidation will enable the index to move even higher.

Bottomline? Chart patterns of BSE Sensex and NSE Nifty indices are at life-time highs. This is not a time to feel scared because of what had happened in Jan ‘08 and Nov ‘10 when the previous index peaks were touched. Nor is it a good time to buy the cats and dogs. Choose fundamentally strong stocks that are still available at fair prices, and accumulate gradually. Both indices are likely to rise to much higher levels.

Related Post

Why Sensex should touch 25000 – a long-term view

(Wishing all blog visitors and investment newsletter subscribers a safe and peaceful Deepavali. May the new year bring happiness and prosperity to all.)