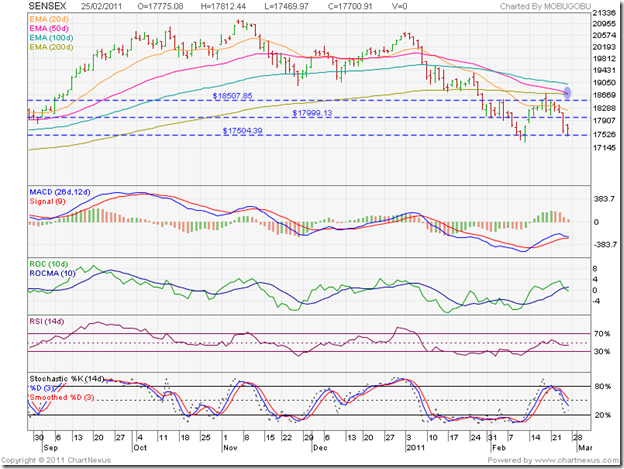
Sitting in India, we tend to become obsessed with what is happening to the Sensex and Nifty. Specially when both indices start heading south. Part of the reason for the recent corrections in emerging markets, including India, is the flight of FII money.
Far away in the USA, KKP can be more objective about investing in global markets. In this month’s guest post, he looks beyond the BRIC (Brazil, Russia, India, China) nations to other markets on the growth path. May be it is time for Indian investors to start developing a global outlook as well, to improve the total returns on their portfolios.
------------------------------------------------------------------------------------------------------------
What Next After BRIC?
So, we all feel that the organic and FDI (investments) in India and China is the end game, right? Wrong. We know that there are frontiers beyond that, and even though India and/or China will be the next super-power of the world, there will be growth in other regions of the world that we need to focus on to keep our investments earning higher returns. We have to, therefore, teach our children to be open minded not just to the ‘change’, but more importantly to the ‘rate of change’ going on in this world. This will move ‘preferred’ investments from one country to another, or one region to another, or as this article points out, from the favourite BRIC’s to the Frontiers! What does that mean? Lets look into it…
We all know the BRIC (Brazil, Russia, India and China) countries, and the tear that they have been in the last 10 years. Lets talk in CAGR terms (Compounded Annual Growth Rates), i.e. total return per year, compounded on an annual cycle.
BRIC in general have done 14.75% CAGR as of Dec 31, 2010. India has done 17.19% CAGR if you were wondering, but you know what – Indonesia did 26.74% CAGR in that timeframe. This is staggering. Being in the US, we have a choice to invest just about in any country through vehicles called ETFs/ETNs. These are a collection of stocks put together by one of the large brokerage houses or fund managers that invest in a basket of stocks following a particular index. So, now, consider Frontier Country ETFs to capture explosive growth in what I calling ‘new markets’. By the way, there are a slew of countries that we (as investors) have ignored for a long time…..although, the countries are not new at all. But the time has come, and that time is now. Here are the current list of countries that belong to this ‘general’ Frontier Country list with the ETF symbols (valid for US investors and informational for Indian Investors):
- THD - Thailand
- ECH - Chile
- TUR - Turkey
- VNM - Vietnam
- IDX - Indonesia
- EPU - Peru
- ESR - Eastern Europe
- GXG - Colombia
- FRN - Diversified across frontier markets (one of my customers)
- FFD - MS Frontier Emerging Markets Fund
These ETFs have been performing really well since Mar 2009, and it’s all been one way and hence it has been hard to find the best entry point. On any pullbacks, I personally will be interpreting it as a buying opportunity and starting to put some money (in SIP mode in USD) for long term investments. Keeping in mind that India used to belong to this group once upon a time, there are risks associated with each of them. They possess risks such as illiquidity, non-transparency, inadequate regulation, substandard financial reporting, and similar hazards. They are at the very edge of the investable public securities universe and along with high potential rewards, come high risk.
MSCI, which is a prominent builder of indices, recently announced their list of the frontier universe which includes the countries listed below. FTSE classified their list of countries slightly differently, but both lists overlap quite a bit.
FTSE classification, frontier markets list as of September 2010:
 Argentina;
  Bahrain;
  Bangladesh;
  Botswana;
  Bulgaria;
  Côte d'Ivoire;
  Croatia;
  Cyprus;
  Estonia;
  Jordan;
  Kenya;
  Lithuania;
  Macedonia;
  Malta;
  Mauritius;
  Nigeria;
  Oman;
Oman;  Qatar;
  Romania;
  Serbia;
  Slovakia;
  Slovenia;
  Sri Lanka;
  Tunisia;
  Vietnam.
As of May 2010, MSCI Barra classified the following countries as frontier markets:
![clip_image002[4] clip_image002[4]](http://lh3.ggpht.com/_c85BpwsJIVk/TWaBYjkKEEI/AAAAAAAACRE/_Z3doVFxIJc/clip_image002%5B4%5D_thumb.gif?imgmax=800) Argentina;
Argentina; ![clip_image004[4] clip_image004[4]](http://lh4.ggpht.com/_c85BpwsJIVk/TWaBaL2d4jI/AAAAAAAACRM/v2KtqNLyQP0/clip_image004%5B4%5D_thumb.gif?imgmax=800) Bahrain;
Bahrain; ![clip_image006[4] clip_image006[4]](http://lh4.ggpht.com/_c85BpwsJIVk/TWaBbwlqhYI/AAAAAAAACRU/rH0WnZ1TnIU/clip_image006%5B4%5D_thumb.gif?imgmax=800) Bangladesh;
Bangladesh; ![clip_image008[4] clip_image008[4]](http://lh4.ggpht.com/_c85BpwsJIVk/TWaBdm-f8_I/AAAAAAAACRc/vwzarD-vam8/clip_image008%5B4%5D_thumb.gif?imgmax=800) Bulgaria;
Bulgaria; ![clip_image010[4] clip_image010[4]](http://lh4.ggpht.com/_c85BpwsJIVk/TWaBfeno6dI/AAAAAAAACRk/dCevvTCNcGE/clip_image010%5B4%5D_thumb.gif?imgmax=800) Croatia;
Croatia; ![clip_image012[4] clip_image012[4]](http://lh6.ggpht.com/_c85BpwsJIVk/TWaBhOpfIpI/AAAAAAAACRs/JVW7AYVxHtU/clip_image012%5B4%5D_thumb.gif?imgmax=800) Estonia;
Estonia; ![clip_image014[4] clip_image014[4]](http://lh4.ggpht.com/_c85BpwsJIVk/TWaBi4Q-TDI/AAAAAAAACR0/Z5_RIhlvuyc/clip_image014%5B4%5D_thumb.gif?imgmax=800) Jordan;
Jordan; ![clip_image016[4] clip_image016[4]](http://lh6.ggpht.com/_c85BpwsJIVk/TWaBku1BEVI/AAAAAAAACR8/kGntRWZwo-M/clip_image016%5B4%5D_thumb.gif?imgmax=800) Kazakhstan;
Kazakhstan; ![clip_image018[4] clip_image018[4]](http://lh4.ggpht.com/_c85BpwsJIVk/TWaBmG_dBRI/AAAAAAAACSE/mp2QqkU8Vwk/clip_image018%5B4%5D_thumb.gif?imgmax=800) Kenya;
Kenya; ![clip_image020[4] clip_image020[4]](http://lh3.ggpht.com/_c85BpwsJIVk/TWaBnggOZQI/AAAAAAAACSM/j8Vg9-lF8mY/clip_image020%5B4%5D_thumb.gif?imgmax=800) Kuwait;
Kuwait; ![clip_image022[4] clip_image022[4]](http://lh6.ggpht.com/_c85BpwsJIVk/TWaBpq5BwcI/AAAAAAAACSU/U_SPIb4M3-0/clip_image022%5B4%5D_thumb.gif?imgmax=800) Lebanon;
Lebanon; ![clip_image024[4] clip_image024[4]](http://lh5.ggpht.com/_c85BpwsJIVk/TWaBrFkmaAI/AAAAAAAACSc/pFclhBqpAwE/clip_image024%5B4%5D_thumb.gif?imgmax=800) Lithuania;
Lithuania; ![clip_image026[4] clip_image026[4]](http://lh3.ggpht.com/_c85BpwsJIVk/TWaBs83h6QI/AAAAAAAACSk/ePpJcwVTI74/clip_image026%5B4%5D_thumb.gif?imgmax=800) Mauritius;
Mauritius; ![clip_image028[4] clip_image028[4]](http://lh4.ggpht.com/_c85BpwsJIVk/TWaBuSvU4zI/AAAAAAAACSs/YbK_S1x_hoc/clip_image028%5B4%5D_thumb.gif?imgmax=800) Nigeria;
Nigeria; ![clip_image030[4] clip_image030[4]](http://lh3.ggpht.com/_c85BpwsJIVk/TWaBv0eZGbI/AAAAAAAACS0/zqCiSN3f6aw/clip_image030%5B4%5D_thumb.gif?imgmax=800) Oman;
Oman; ![clip_image032[4] clip_image032[4]](http://lh3.ggpht.com/_c85BpwsJIVk/TWaBx0N9iwI/AAAAAAAACS8/KxWRvlk4DzM/clip_image032%5B4%5D_thumb.gif?imgmax=800) Pakistan;
Pakistan; ![clip_image034[4] clip_image034[4]](https://blogger.googleusercontent.com/img/b/R29vZ2xl/AVvXsEjXxAcnS01S673AJdSxCMqQygb3QF0SMW0TS9iulDxE-7OicFWVK179djZvNLFFC3M_pJhw7FKuKwwhEynsBkpcGMwYU74-oJIeoo5QW1Xh0i9TAdugi5QIl8AqSW4zHvyVgIc0Vhd4Sv0/?imgmax=800) Qatar;
Qatar; ![clip_image036[4] clip_image036[4]](http://lh3.ggpht.com/_c85BpwsJIVk/TWaB1aTnJcI/AAAAAAAACTM/EtFRTP7G8QQ/clip_image036%5B4%5D_thumb.gif?imgmax=800) Romania;
Romania; ![clip_image038[4] clip_image038[4]](http://lh4.ggpht.com/_c85BpwsJIVk/TWaB3PMdzNI/AAAAAAAACTU/Fgo1sjJlfBk/clip_image038%5B4%5D_thumb.gif?imgmax=800) Trinidad and Tobago;
Trinidad and Tobago; ![clip_image040[4] clip_image040[4]](http://lh6.ggpht.com/_c85BpwsJIVk/TWaB478cN7I/AAAAAAAACTc/x42hfdKSdf4/clip_image040%5B4%5D_thumb.gif?imgmax=800) Serbia;
Serbia; ![clip_image042[4] clip_image042[4]](http://lh3.ggpht.com/_c85BpwsJIVk/TWaB6t9WspI/AAAAAAAACTk/5W_uundfl7c/clip_image042%5B4%5D_thumb.gif?imgmax=800) Slovenia;
Slovenia; ![clip_image044[4] clip_image044[4]](http://lh5.ggpht.com/_c85BpwsJIVk/TWaB8d7Z1YI/AAAAAAAACTs/N9NEsbF4q_Q/clip_image044%5B4%5D_thumb.gif?imgmax=800) Sri Lanka;
Sri Lanka; ![clip_image046[4] clip_image046[4]](http://lh5.ggpht.com/_c85BpwsJIVk/TWaB-CyikTI/AAAAAAAACT0/GhloBo7Vukw/clip_image046%5B4%5D_thumb.gif?imgmax=800) Tunisia;
Tunisia; ![clip_image048[4] clip_image048[4]](http://lh5.ggpht.com/_c85BpwsJIVk/TWaB_v9IaFI/AAAAAAAACT8/sAaX26wr2_c/clip_image048%5B4%5D_thumb.gif?imgmax=800) Ukraine;
Ukraine; ![clip_image050[4] clip_image050[4]](http://lh3.ggpht.com/_c85BpwsJIVk/TWaCBWcTlTI/AAAAAAAACUE/n0e204fRI3M/clip_image050%5B4%5D_thumb.gif?imgmax=800) United Arab Emirates;
United Arab Emirates;  Vietnam;
  Bosnia and Herzegovina;
  Botswana;
  Ghana;
  Jamaica;
  Saudi Arabia.
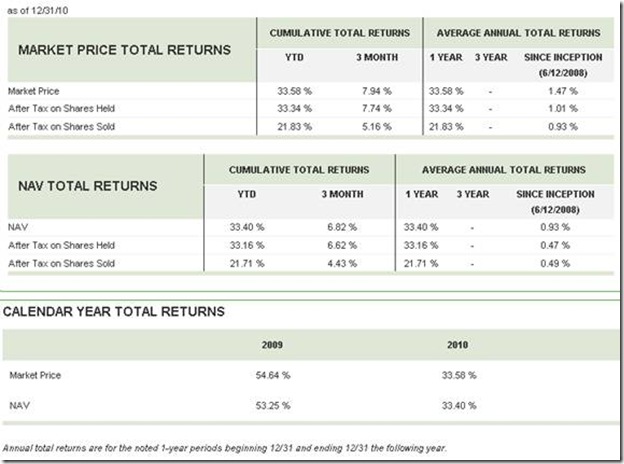
Here is the performance of the Guggenheim Frontier Equity ETF, which is one of the few choices available today. Since this concept of Frontier countries is new, there are not too many funds out there that do this investment, although many ETFs include them in their Asia funds or Latin America fund or even Eastern European funds/ETFs. I happen to like Guggenheim investments since they have been a good customer of mine in the technology world, and have done a lot of technology upgrades within their infrastructure to enable the fund managers to do their job well. Now, that does not necessarily mean good investment results, but they also happen to have great investment results relative to their peers. Guggenheim services a set of private clients who we would call the filthy rich families, i.e. ones with more than $10M in Net Worth!

As you can see from the performance, I rest my case, and even though I have woken up a bit late to these investment type, I think these are young, dynamic, and real-growth-engines that will see their middle income earners grow within their own countries, and provide some real contributions to their own GDPs. Where there is return, there is risk, so while bearing that in mind, one has to invest only a portion of the portfolio and manage the overall risk. When the overall geography turns sour in a bearish environment, I am sure these markets will go down faster, bearing a higher volatility factor than the average. Just another chink in the armour that I am now providing to you to include and manage as you think about future-proofing your portfolio with an ultra positive return kicker!
What do you think?
------------------------------------------------------------------------------------------------------------
KKP (Kiran Patel) is a long time investor in the US, investing in US, Indian and Chinese markets for the last 25 years. Investing is a passion, and most recently he has ventured into real estate in the US and also a bit in India. Running user groups, teaching kids at local high school, moderating a group in the US and running Investment Clubs are his current hobbies. He also works full time for a Fortune 100 corporation.


