Sunday, October 31, 2010

European Index Chart Patterns – 1 year charts

The 5 years European index chart patterns – except Stockholm General and DAX - were struggling around their 50% Fibonacci retracement levels and 200 day EMAs when I looked at them earlier this month.

Things appear to have improved since then – if not in the respective economies, definitely in the stock market sentiments – as the 1 year charts depict below.

Austria ATX Index Chart

image

The Austria ATX index chart is above its three rising EMAs, and has made bullish higher tops and bottoms since the Jul ‘10 low. Crossing the Apr ‘10 top will put the bulls back in the driver’s seat.

France CAC 40 Index Chart

image

The CAC 40 index chart has been one of the laggards. Despite the wide-scale protests against the austerity measures, the index is showing bullish tendencies as it makes higher tops and bottoms. The RSI is indicating that the going will not be very smooth for the bulls.

Germany DAX Index Chart

image

The DAX index chart continues its impressive performance – receiving support from the rising 200 day EMA. The German index has been in a bull market for more than a year, and keeps making new highs – reflecting a stronger economy.

Netherlands AEX General Index Chart

image

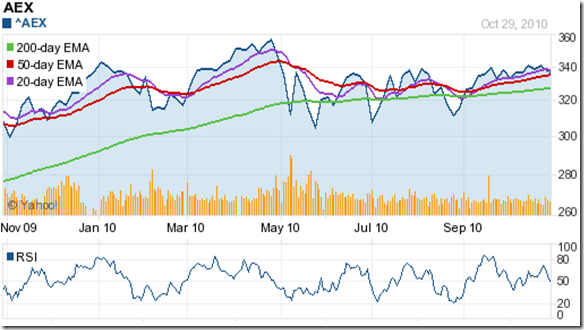
The AEX General index chart hasn’t been able to make too much headway. It has been trading between 300 and 360 for the past year, but remains above the rising 200 day EMA – the sign of a bull market. The RSI indicates that the current correction may last a little longer.

Oslo All Share Index Chart

image

The Oslo All Share index chart has just edged above the Apr ‘10 top and the bull market is expected to gather strength. The lower top on the RSI means there may be speed bumps along the way.

Madrid General Index Chart

image

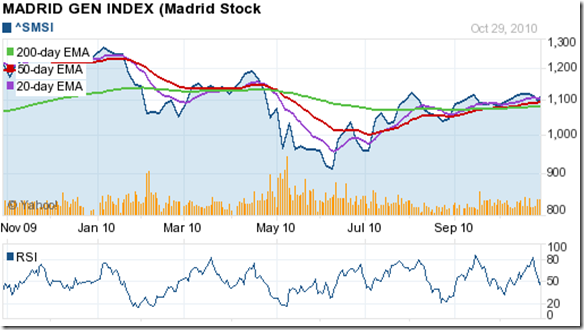
The woes of the Madrid General index chart are far from over. The brief bullish aspirations seem to have been snuffed out by the plummeting RSI. The Spanish index remains the underperformer among the European indices.

Stockholm General Index Chart

image

The Stockholm General index chart – the best performer – is facing a bit of headwind after touching the 350 mark. The negative divergence in the RSI may cause a deeper correction. The rising 200 day EMA has provided good support during earlier corrections. There is no immediate threat to the bull market.

Swiss Market Index Chart

image

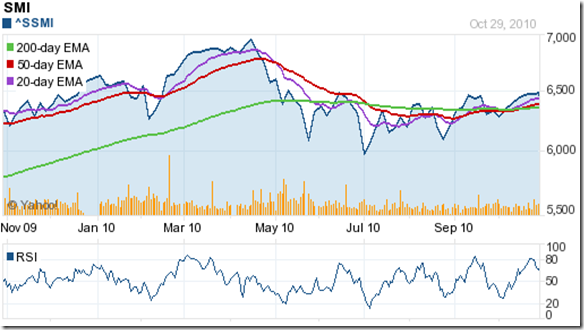
The Swiss Market Index chart is faring marginally better than the Madrid General, but remains an underperformer. For the past 6 months, the 6500 level has provided strong resistance.

UK FTSE 100 Index Chart

image

The FTSE 100 index chart made a valiant but unsuccessful effort to get past its Apr ‘10 top. The recently announced austerity measures seem to have dampened the bullish fervour. The RSI has slipped below the 50% level and is showing negative divergence. The bears may tighten their grip. The index is well above the rising 200 day EMA, so there is no immediate threat of a trend change.

Bottomline? The 1 year European index chart patterns are suggesting that the various austerity measures will strengthen the economies in the long run, but will act as a deterrent to faster growth. The gains from the markets are likely to be muted. Time to take a look at emerging market investments?

Friday, October 29, 2010

BSE Sensex and NSE Nifty 50 Index Chart Patterns – Oct 29, ‘10

BSE Sensex Index Chart

SENSEX_Oct2910

The BSE Sensex index chart pattern shows the continuing struggle between the bulls and bears, with the bulls conceding 134 points on a weekly basis but ensuring that the low of 19772 remained unbreached and the psychological 20000 level was regained. That was the good news.

Now the bad news. The Sensex has formed a bearish head-and-shoulders pattern, with the left shoulder at 20268 (formed in Sep ‘10), the head at 20854 and the right shoulder at 20452 (both formed in Oct ‘10). The neck-line of the pattern is at 19845 – just above the support level of 19772. If the pattern plays out, the downward target will be 18836. Say, 18800 – since we don’t deal with exact levels in technical analysis. That means a possible 1200 points (6%) drop from today’s weekly (and monthly) closing level of 20032, and a 2000 points drop from the peak of 20854.

Could the index fall further? Sure it can – if the FIIs start booking profits. They sold Rs 950 Crores worth on Thu. Oct 28 ‘10, but today were net buyers to the tune of Rs 750 Crores. Even the DIIs were net buyers today. On the down side, there should be strong support at 18500 and from the rising 200 day EMA (at 18050).

The technical indicators have weakened further. The MACD is below the signal line, and both are falling in positive territory. The RSI has slipped below the 50% level, but has stopped falling. The slow stochastic is about to re-enter the oversold zone. The correction is likely to continue next week.

NSE Nifty 50 Index Chart

Nifty_Oct2910

The NSE Nifty 50 index chart pattern found support at the previous low of 5932 and regained the psychological 6000 level. The volume data is showing ‘distribution’ – higher volumes on down days. Ideally, the volumes should have been lower during the formation of the right shoulder of the head-and-shoulders pattern (also visible on the Nifty chart).

With the left shoulder at 6018, the head at 6284, the right shoulder at 6151 and the neck-line at 5963, the down side target for the Nifty is 5642. Say, 5600. That’s a 400 points (6.5%) drop from today’s weekly and monthly closing level of 6018.

The technical indicators are hinting at a continuation of the correction. The MACD is below the signal line, and both are falling. The MFI and RSI are below their 50% levels. The slow stochastic has re-entered the oversold zone.

Food inflation rate has receded a little – more due to the base effect than any actual reduction in food prices. Q2 results declared so far have been mixed. Even some of the outperformers are showing a slow down in profit margins. The prolonged monsoon has affected the fortunes of cement manufacturers as well as metals, construction and real estate companies. Adverse publicity caused by the woeful mismanagement of the Commonwealth Games preparations have hit the profits of hotel companies.

Bottomline? The chart patterns of the BSE Sensex and NSE Nifty 50 indices are taking a break from a long bull rally. A 10-15% correction will be healthy for the next stage of the rally. As long as the indices stay above their rising 200 day EMAs, the bull market will remain in tact. Stay invested. Let the correction play out before buying.

Thursday, October 28, 2010

Notes from the USA (Oct 2010) – a guest post

The gravity-defying bull run in gold prices is the dominant story in the investment world - a flight to safety caused by the fall in the value of the US Dollar against global currencies, as the western economies trudge along on the long road to economic recovery.

In his guest post this month, KKP explains the relationship between two of the major forces that drive the global economy – the US Dollar and gold prices. He also gives practical advice about what investors should do if they are contemplating an investment in gold (or precious metals) now.

---------------------------------------------------------------------------------------

Gold, Dollar and Economy

clip_image002

A Brief History of Gold and the Dollar

So, what is puzzling everyone is what is happening with US$, Gold, US Economy, and Global Economy. Well, this is a complex puzzle, but one that should be understood well to know what we are going through, and what is coming at us….

Gold does relate to the dollar…..Up until now it related inversely (mathematically speaking). Gold almost never changes in value under that theorem. It is the dollar that revalues in relationship and valuation of gold. For example, in 1920 a good quality men's suit cost a typical $20 gold piece (I collect some of these coins myself). A similar custom-sown, quality, name-brand suit today can be purchased with about the same amount of gold. So, then why this mad rush into gold, you might say.

Let’s first understand the history lesson of relationship of gold and dollar, and then bring it quickly to the current timeframe. The true relationship is tied to the concept of physical or tangible asset versus a paper-based financial asset. Tangibles like real estate or an antique painting has a real value, while the paper-based dollar is just a representation of the underlying real value (subject to change).

In 1944, the Bretton Woods Agreement launched the first system of convertible currencies and fixed exchange rates, requiring participating countries to maintain the value of their currency within a narrow margin against the US dollar, which was fixed at a rate of $35 per gold ounce. However, in the 1950s and 1960s, the increasing supply of US dollars along with capital outflows aimed at Europe’s postwar recovery put downward pressure on the dollar. Eventually, a series of dollar devaluations in the early 1970s ended the Bretton Woods system, allowing the dollar to be freely traded and freely sold, beginning the long drawn-out period of the falling dollar. And, it is still falling…

clip_image002[6]

Inverse Relationship of Gold and Dollar

The most recent memory that most investors have in currency/equity/commodity markets is the inverse relationship between the US Dollar Index and the Price of Gold. This relation occurs because gold has for the longest time been used as a hedge against inflation. As the value of the dollar decreases, it will take more dollars to buy a gold coin, and therefore it automatically increases the price of gold. Now, why does the dollar value fluctuate in the first place? It does so, based on Washington’s thought process, comments and shifts in the monetary policies (Federal Reserve). Volcker, Greenspan and now Bernanke have been carefully weighing the movements of rates, inflation as well as valuation of the dollar all of these years. Over the last few decades, Fed has used the fed-funds rate to control inflation and stimulate the economy, and therefore, affected the price of gold. Value of Gold is for the most part determined by the supply and demand, as it should be, without interference from shifts in Washington’s monetary policies. No…no. As we said earlier, they are inversely proportional, and hence it fluctuates based on value of dollar and also the supply/demand (production of gold vs. demand by consumers/industries) characteristics.

If you look between Jan ‘99 and Jun ‘08, the correlation between dollar and gold has been a -0.85 (negative), indicating a very close negative correlation (inverse). Temporary inconsistencies have also occurred as noticed between Apr-Dec ’05. This is when the correlation switched to a +0.68 (both moved in the same direction). All of that was due to the policy shifts affecting the dollar.

clip_image002[8]

So, when Fed lowers rates, corporate and personal borrowers take out loans and supply of money increases in the system. Demand for dollar decreases, and therefore dollar goes down in value. When they hike the rates, putting the reigns on inflation, it pumps money back out, and strengthens the dollar. When dollar becomes stronger, it naturally devalues gold.

Current Mayhem in Dollar and Boost in Gold

My money market or savings earns 0.01% per annum (compounded), even for amounts over $10,000! With the rates this low the dollar’s widespread sell-off continues with the Euro hitting its highest level against the greenback and the Japanese Yen reaching a 15-year high. The dollar index (DXY is an index of a bunch of western currencies) reached its lowest point of the year, confirming a mass movement-against-dollar with investors chasing higher yields in other currencies. Another sign of US dollar weakness is demonstrated by the number of currencies passing parity (e.g. 1 Canadian dollar buys more than 1 USD). Canadian dollar moved up in 2010 and the Australian dollar recently hit parity having risen to its highest level in over 25 years. This is why I have been moving my money to Australia.

The US dollar’s decline also highlights the sputtering American economy versus many other countries. Bernanke just confirmed a few days ago that the Fed may have to undertake another round of bond-buying which will devalue the dollar further. He is almost copying what other central bankers are doing, which is why all of those currencies are going down also. This is precisely why I started moving US$ to Australia where there has been tightening monetary policy through rate hikes. With family in Australia, I am doing it without much worry.

Gold’s Current Rally

Gold is in the midst of the greatest bull market of all times because interest rates have been at historic lows and dollar is weak. The sputtering global economies have caused major nervousness to the point that the pundits are predicting a complete collapse of certain countries including the US in 2010-2012. In response, gold has enjoyed a run throughout 2009 & 2010 as investors worried about inflation, countries going bankrupt, individual states within the US shutting down, and the mounting US debt (a time-bomb waiting to blow, as some people think). Again, whenever people got spooked by any financial instrument in the past 20-30 years, gold had become the safe-haven to go to. Recently at a party, Gold was the major topic of discussion. Usually, this indicates a sign of too much optimism, which generally leads to a correction down the road. Remember the reverse happens even faster like any other boom, but it is unlikely to happen in the near future for Gold/Silver/Platinum/Diamond based on the circumstances facing Europe and North America today.

So, a Logical Question: Should you Swallow the Gold Pill?

clip_image002[10]

Well, this is always the age old question that gets asked in any Bull Market. It is hard to answer for people who feel left out. Inflation concerns are real, USD issues are real (with the massive printing going on), and future of many countries can be questioned with ease. So, is gold then a good safe-haven?

My feeling is that if there is any recovery in the US and/or Europe, there will be a resting phase for gold that may happen in 2011 and 2012, when the ‘bubble mania’ shifts the attention from commodities to equity or bonds. When media starts ringing the bell on any investment avenue (as published reports in Barrons, Time, Newsweek exemplify), it doesn’t stay up too long. So, my feeling is that new investment funds should wait it out if you are not already invested in gold/precious metals. If you are already invested in gold/silver/platinum/diamond, then hold on for now.

Will gold go to $1400-1500 per ounce and then come back and settle at $1000-1100? Maybe. Q4 ’10 through Q2 ’11 will be a big test for a lot of countries, economies and families. If economies sputter forward in the US/Europe without any major Obama or Federal Reserve or EU interventions, we will have higher rates which will strengthen the dollar and give us that buying opportunity. And, that is all we can hope for since most investors live on optimism…

PS: I am a holder of Gold, Silver, Diamond in various forms, including ETF, and hence may have a biased opinion.

PPS: Click on the hyperlink below or type the URL to get the chronology of what happened between 1792 and 1973:

History of the Dollar's Connection to Gold - An Outline(http://www.coinsite.com/content/faq/dollarvsgold.asp)

--------------------------------------------------------------------------------------

KKP (Kiran Patel) is a long time investor in the US, investing in US, Indian and Chinese markets for the last 25 years. Investing is a passion, and most recently he has ventured into real estate in the US and also a bit in India. Running user groups, teaching kids at local high school, moderating a group in the US and running Investment Clubs are his current hobbies. He also works full time for a Fortune 100 corporation.

Tuesday, October 26, 2010

It is Q2 results season – can you spot good earnings management?

Now that the Coal India IPO is successfully out of the way (i.e. with considerable oversubscription), one of the major uncertainties about the future direction of the Indian stock markets has been removed. There was no large-scale selling visible in the secondary markets – as the FIIs brought in new funds to subscribe to the IPO.

The focus has now shifted to the Q2 results season. The continued volatility in the Sensex and Nifty is an indication that the investing community is uncertain about how the results will pan out. The uncertainty is compounded by the fact that the Sensex is trading around the 20000 level – just below its Jan ‘08 all-time high.

Those who believe that expected good results have already been ‘discounted’ by the current stock market index levels are bearish, and worried about a huge 2008-like fall. Those who think that earnings will surprise on the up side are bullish, and betting on a 25000 Sensex target.

Why does the quarterly results season generate so much tension, anxiety and uncertainty amongst traders and investors? Earnings, or net profits, are often treated as the most important factor in a financial statement. For estimating the ‘intrinsic value’ of a company, the present value of its future earnings is calculated using the Discounted Cash Flow (DCF) method. Increased earnings has a salutary effect on the stock’s price. A drop in net profit leads to selling.

What is earnings management and why do companies indulge in it? Simply put, earnings management (as opposed to ‘cooking the books’ a la Satyam Computers) means using legal accounting methods to ‘dress up’ the net profit figure to meet or exceed analysts’ expectations.

Why would a company resort to earnings management? The cynical answer is: the top executives want to save their skin and ensure that their own company stock holdings don’t drop in value. Even a well-respected multinational like Hindustan Unilever resorted to earnings management when they declared their Q2 results yesterday.

The headline in the business page of a leading daily was: ‘Lever posts 32% rise in net’. To be fair, the company did mention that exceptional gains of Rs 40 Crores during the period compared with exceptional costs of Rs 135 Crores in the same period of the previous year led to the 32% growth. Without the exceptional items, the profit grew only 6.8%.

How can you spot whether a company is resorting to earnings management or not? The disclosure details during quarterly results announcements are not adequate to spot all the legal (and illegal) accounting methods adopted by different company managements. But investors would do well to look beyond the headlines and interim dividend announcements to check the details that are published.

Any unusual increase or decrease in earnings is a ‘red flag’ and needs to be investigated further. Some times, excellent earnings announcements by not-so-excellent companies are accompanied by various fund-raising plans. The idea being to cash-in on the good feelings generated amongst the investing community.

Pay careful heed to the reasons for the fund-raising. If it is for increasing production capacities or entering new geographical territories, it is a positive. But raising money to reduce/pay-off earlier debts, or to pay taxes and dividends on earnings that do not generate a corresponding positive cash flow from operations is a negative.

Managers that always promise to ‘make the numbers’ will at some point be tempted to ‘make up the numbers’ – Warren Buffett

Monday, October 25, 2010

Stock Index Chart Patterns – Dow Jones (DJIA) and FTSE 100 – Oct 22 ‘10

Dow Jones (DJIA) Index Chart

image

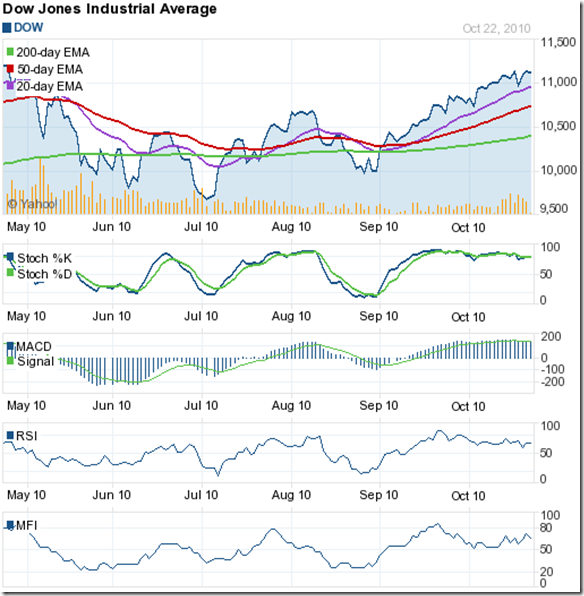
The Dow Jones (DJIA) index chart pattern continues to grind upwards, but seems to be hesitating as it approaches the Apr ‘10 top of 11309. The index dipped towards the rising 20 day EMA on Tue. Oct 19 ‘10 after opening with a downward gap. The gap got filled the next day. On Thu. Oct 21 ‘10, the Dow touched a high of 11250, a level last reached 6 months ago, but closed the week at 11133 – 70 points higher on a weekly basis.

All three EMAs are rising with the index above them. Volumes picked up during the week. But the technical indicators are showing negative divergences. The slow stochastic is moving sideways, just below the overbought zone. The MACD is positive and touching the signal line, but also moving sideways. The RSI and MFI are both above their 50% levels, but have made lower tops while the Dow made higher tops.

Leading economic indicators are positive and showing no signs of a double-dip recession. Corporate earnings are positive as well, but companies are sitting on their cash and not hiring much. Till the Apr ‘10 top is overcome convincingly, the bears will stay in the fight.

FTSE 100 Index Chart

image

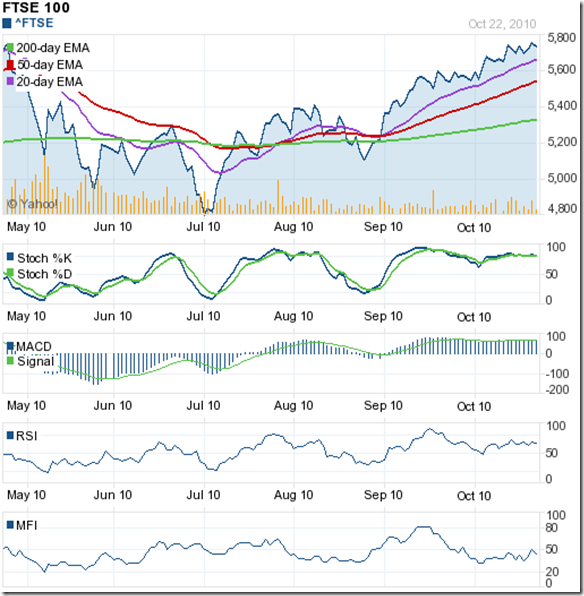
The FTSE 100 index chart pattern and the Dow chart look like two peas from a pod. The index touched a high of 5787 on Thu. Oct 21 ‘10 – the highest it has reached in 6 months, but closed with a weekly gain of only 38 points. The Apr ‘10 top of 5834 is proving elusive.

All three EMAs are rising with the index above them. Volumes have been nothing to write home about. All four technical indicators are displaying negative divergences – making flat or lower tops as the FTSE moved higher. The notable difference is the MFI, which is below the 50% level due to the low transaction volumes.

The sharpest cuts to public spending since World War II were announced on Wednesday — slashing benefits and cutting public sector jobs with an austerity plan aimed at clearing record debts that swelled during the global financial crisis. Will it work to revive the UK economy? I’m tempted to quote Bob Dylan: “..time will tell just who has fell and who’s been left behind.”

Bottomline? The chart patterns of the Dow Jones (DJIA) and FTSE 100 indices are back in bull markets, but are hesitating just below their Apr ‘10 tops. Threats of a double-dip recession may be receding. But the US and UK economies are far from getting back on real growth tracks. Stay invested. Buy selectively - only if you find compelling value.

Sunday, October 24, 2010

Asia Pacific Index Chart Patterns – 1 year charts

Three weeks back, I had posted the 5 years chart patterns of the Asia Pacific indices. Today, let us take a look at the 1 year chart patterns.

Shanghai Composite Index Chart

image

The Shanghai Composite index chart has risen sharply above the 200 day EMA. The 20 day EMA has done the same after remaining entangled with the 50 day EMA for two months. The 50 day EMA is about to cross above the 200 day EMA to confirm a return to the bull market after 6 months.

Such a sharp rise is usually followed by a correction or consolidation. That would provide opportunities to add. Note that the RSI has made a higher top than the one in Apr ‘10, when the index was higher. The positive divergence is encouraging for the bulls.

Hang Seng Index Chart

image

The Hang Seng index chart pattern reached a 52 week high supported by strong volumes. All three EMAs are moving up with the index above them – a bullish sign.

The RSI has dropped from the overbought zone and failed to make a new high. Use corrections to add.

Taiwan TSEC Index Chart

image

The Taiwan TSEC index chart had a small correction and dropped below the 20 day EMA down to the rising 50 day EMA after testing the Apr ‘10 top, but has bounced up above the 20 day EMA. Except for a brief stay below the 200 day EMA in May and Jun ‘10, the index has remained above the rising long-term moving average through the year. Sign of a bull market.

The RSI has dropped below the 50% level. There may be a bit of consolidation before the TSEC can move up above the Jan ‘10 top.

Australia All Ordinaries Index Chart

image

The Australia All Ordinaries index chart is taking support from the 20 day EMA on its way up. The up move that started from the Jul ‘10 low has taken the index above the 200 day EMA, but the Apr ‘10 top may prove to be a tough hurdle.

The RSI is above the 50% level, but has made progressively lower tops as the index moved higher during Sep and Oct ‘10. The negative divergence could be indicating a consolidation before the next up move.

New Zealand NZX50 Index Chart

image

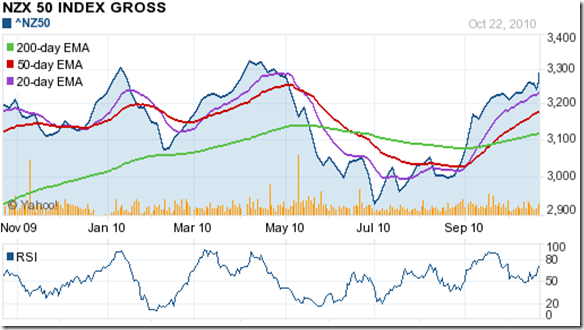
The New Zealand NZX50 index chart has rallied much more spiritedly since the Jul ‘10 low and has almost regained its losses. Volumes haven’t been all that great.

The RSI is rising above the 50% level, but has made lower tops as the index rose higher. A correction in the offing? Any dips can be used to add. 

Korea KOSPI Index Chart

image

The Korea KOSPI index chart has been in a bull market through the past year, with the index remaining above the rising 200 day EMA. Twice it sought support from the long-term moving average and resumed its upward move immediately thereafter.

The RSI has dropped to the 50% level while the index consolidated sideways after touching the 1900 mark. Use dips to add.

Malaysia KLCI Index Chart

image

The Malaysia KLCI index chart has also been in a bull market during the past 12 months. The dip below the 200 day EMA in Jan ‘10 appears to be a data error or a freak trade. Volumes have picked up considerably, which is a bullish sign.

The RSI is above the 50% level, but made a lower top as the index touched the all-time high of 1500. Any corrections will provide opportunities to add.

Singapore Straits Times Index Chart

image

The Singapore Straits Times charts is in a bull market and touching new highs on a regular basis. The same can not be said about the RSI, which has been making lower tops. Use corrections or consolidations to add.

Jakarta Composite Index Chart

image

The Jakarta Composite index chart has been the best performer among the Asia Pacific indices during the past 12 months. It is consolidating sideways after crossing the 3500 level. Volumes have remained strong.

The RSI has dropped from the overbought zone towards the 50% level, hinting at a possible correction. Use it to add.

Japan Nikkei Index Chart

image

The Japan Nikkei index chart is unable to extricate itself from a tight bear grasp, as it keeps sliding below a falling 200 day EMA. A brief up move on good volumes found strong resistance from the long-term moving average.

The RSI has dipped below the 50% level. Looks like there is no end to the misery of the Nikkei index.

Bottomline? The one year chart patterns of the Asia Pacific indices – except the Nikkei - are looking stronger by the day. Jakarta Composite and Malaysia KLCI remain the two best performers. Singapore Straits Times, KOSPI Korea and Taiwan TSEC are the next three that have done well. Stay invested, or add on dips with adequate stop-losses. Investors in Nikkei should get out and redeploy in neighbouring indices.

Saturday, October 23, 2010

Stock Index Chart Patterns - BSE Sectoral Indices, Oct 22, '10

BSE Auto Index

BSE Auto Index

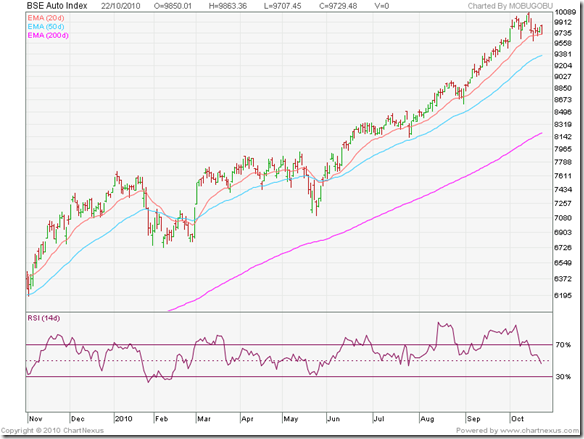
The BSE Auto index chart continues its strong upward move. A bit of correction set in after touching another new high in Oct ‘10. The 20 day EMA has provided good support. The RSI has dropped below the 50% level and is making lower top and bottoms. The correction may not be over yet.

BSE Bankex

BSE BANKEX

The BSE Bankex chart also touched a new high this month before starting to correct. It dropped below the 20 day EMA before recovering. The RSI is making lower tops and bottoms and has fallen below the 50% level. The index may correct some more.

BSE Capital Goods Index

BSE Capital Goods Index

The BSE Capital Goods index touched a new high in Oct ‘10 before correcting sharply down to the 50 day EMA.. Though the index has made higher tops and bottoms last week, the RSI has done the opposite – making lower tops and bottoms and hinting at a longer correction.

BSE Consumer Durables Index

BSE Consumer Durables Index

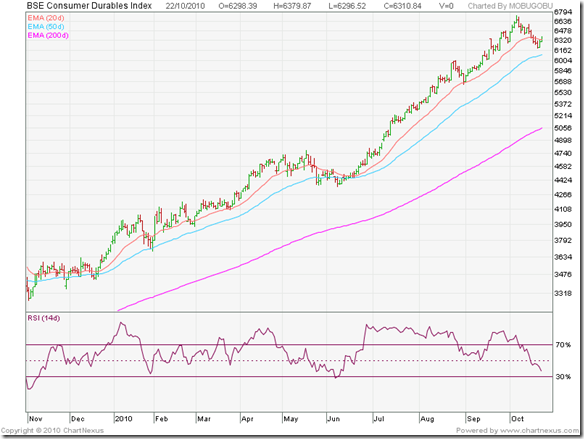
The BSE Consumer Durables index fell less sharply after touching a new high. But even as it tries to recover, the RSI is diving towards the oversold zone.

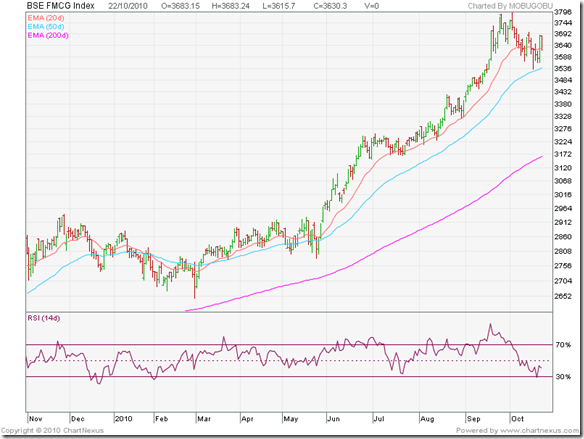
BSE FMCG Index

BSE FMCG Index

The BSE FMCG index made a new high right at the beginning of the month and immediately started a correction that went down to the rising 50 day EMA. The RSI bounced up after touching the oversold zone, but remains below the 50% level – which is bearish.

BSE Healthcare Index

BSE Healthcare Index

The BSE Healthcare index chart has been the outstanding performer in Oct ‘10. The RSI is in the overbought zone, but it has made a lower top as the index made a new high. A correction may be around the corner.

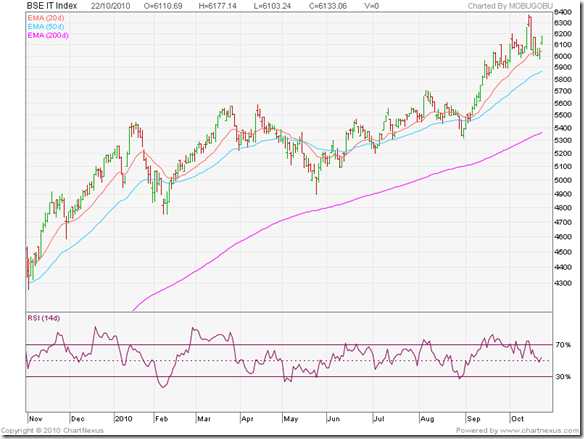
BSE IT Index

BSE IT Index

The BSE IT index also made a new high in Oct ‘10, dropped like a stone below the 20 day EMA and then recovered quickly. The RSI has bounced up after touching the 50% level – which is a bullish sign.

BSE Metal Index

BSE Metal Index

The BSE Metal index chart rose higher during the month, but failed to get close to its 52 week high of Apr ‘10. It started a correction and is currently below the 20 day EMA. The RSI has rapidly fallen below the 50% level. The chart seems to be forming the ‘handle’ of a bullish cup-and-handle pattern.

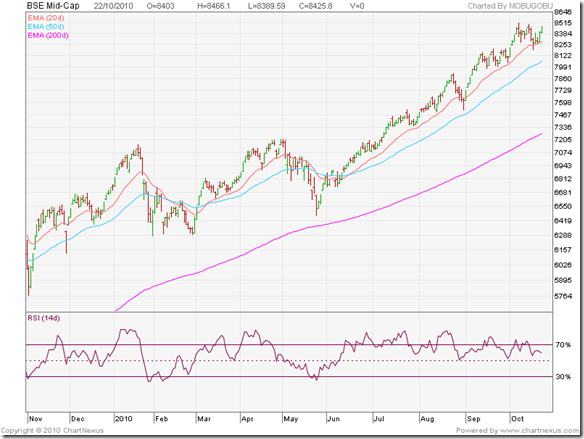
BSE Midcap Index

BSE Mid-Cap

The BSE Midcap index chart is performing quite well, touching a new high, correcting down to the 20 day EMA and almost recovering its losses. The RSI has made a series of lower tops in the overbought zone as the index has moved higher during the past 3 months, but is above the 50% level.

BSE Oil & Gas Index

BSE Oil & Gas Index

Finally, some action from the BSE Oil & Gas index chart. It reached a new high in Oct ‘10, dropped below the 20 day EMA and is testing its high. The RSI is showing negative divergence but is above the 50% level.

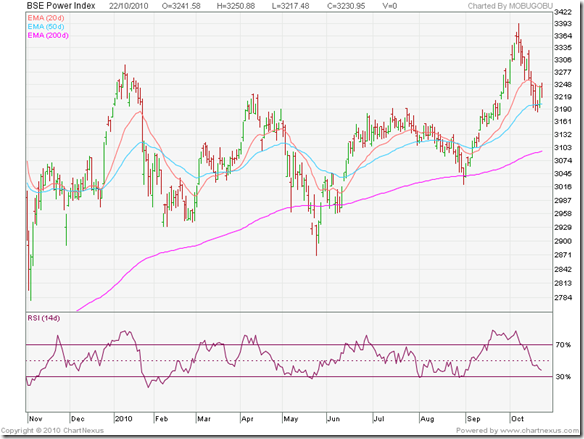
BSE Power Index

BSE Power Index

The BSE Power index chart flattered only to deceive. It touched a 52 week high and immediately started falling and slipped below the 50 day EMA. It has recovered up to the 20 day EMA, but the RSI is headed down to the oversold zone – indicating that the correction may not be over.

BSE PSU Index

BSE PSU

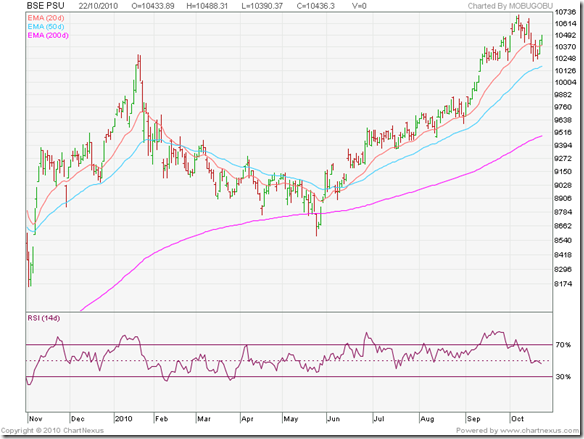
The BSE PSU index chart is in the process of forming the ‘handle’ of a bullish cup-and-handle pattern. It made a new high this month before dropping below the 20 day EMA. The RSI is just below the 50% level.

BSE Realty Index

BSE Realty Index

The BSE Realty index chart is the underperformer of the group – making a series of higher tops and bottoms since the low in May ‘10 but failing to reach a new 52 week high. The recent correction has dropped the index below the 20 day EMA. The RSI has quickly fallen below the 50% level.

BSE Smallcap Index

BSE Small-Cap

The BSE Smallcap index chart is performing well, much like its Midcap counterpart. The RSI has made lower tops in the overbought zone in the past 3 months, and is just below the overbought zone.

The chart patterns of the BSE Sectoral indices are in corrective modes after touching new highs. The BSE Healthcare index gets the ‘chart of the month’ award.

Friday, October 22, 2010

BSE Sensex and NSE Nifty 50 Index Chart Patterns – Oct 22, ‘10

BSE Sensex Index Chart

Sensex_Oct2210_6m

The BSE Sensex index chart pattern shows the inconclusive struggle between the bulls (FIIs) and bears (DIIs), with the bulls gaining a marginal advantage – a 40 points higher close on a weekly basis.

More importantly, the index bounced up after testing the previous bottom of 19772 (the lower edge of the narrow trading range mentioned last week), and closed above the 20 day EMA.

The technical indicators have weakened further. The MACD is below the signal line and falling in positive territory. The RSI has slipped below the 50% level. The slow stochastic touched the oversold zone before moving up a bit. Another test of the support level may be on the cards.

Though the 20 day EMA has flattened, the 50 day and 200 day EMAs are both rising. The Coal India IPO has been oversubscribed more than 20 times, and the FIIs are still net buyers in the secondary market. Inflation has eased a little. The few Q2 results declared so far have been mixed. On the upside, the previous high of 20855 may provide resistance.

NSE Nifty 50 Index Chart

Nifty_Oct2210_6m

The volume data in the NSE Nifty 50 index chart adds a different – more bearish – perspective. After crossing the 6000 level, the volumes on down days have been higher than those on up days – which is a sign of distribution.

The previous low of 5932 provided support, but it may not do so the next time. Fortunately for the bulls, the rising 50 day EMA is not too far below the support level. A drop down to the 50 day EMA could provide the bulls with enough motivation to try and push the Nifty to a new high. Expect resistance at the previous top of 6284.

Bottomline? The BSE Sensex and NSE Nifty 50 index chart patterns continue to show technical weakness. There is no signs of a trend change. This is just a corrective phase in a bull market. Stay invested, but be prepared for a sharp correction. The FIIs are likely to start booking some profits before the end of the calendar year.

Thursday, October 21, 2010

Do you like short-term Trading or long-term Investing?

One of the questions I face most often from readers is: How do I become a trader? I usually answer back with a question: Why don’t you want to become an investor? The answers vary from “I don’t have time to do stock research”, to “I don’t have enough capital”, to “I can’t ever become a Warren Buffett or Rakesh Jhunjhunwala – so why bother”!

New entrants to the stock market usually show up in droves when the Sensex is near an all-time high, thinking that: ‘trading is easy work, and investing is hard work’. The result of such thinking (or is it non-thinking?) is a quick depletion of savings that scares away most would-be traders from the stock markets altogether; or, a transformation of a would-be trader into an investor-by-default, whose quest becomes to somehow recover the trading losses by ‘averaging’ and holding on to the loss-making stocks.

This cycle gets repeated again and again at every market peak that adds to the misery of many newbies and the wealth of a handful of smart investors. I have no illusions that I will be able to change such behaviour akin to financial suicide. But my efforts at repeating this theme periodically is with the hope that a few readers of this blog may see the light.

Let me counter the three most common excuses given by readers to justify their trading ambitions.

I don’t have time to do stock research

Time is at a premium for those engaged in a full-time job or business. When there is insufficient time to complete the tasks at hand, where is the time to perform sector analysis, assess management competence, determine growth prospects, go through annual reports?

There is a simple answer. Delegate the job to a professional fund manager. They are paid (quite handsomely) to manage large funds on behalf of small investors. They have research teams that do all the hard work, and in turn, they charge a fee that is deducted from the fund’s earnings.

I’m not talking about a Private Equity fund or a Portfolio Management System – but an ordinary actively-managed equity mutual fund. Better still, choose an index fund (or index ETF) that is passively managed and charges lower fees. By investing small amounts, one can effectively buy a basket of good stocks or all the stocks that comprise an index.

I don’t have enough capital

Investing in the stock market doesn’t mean that you have to start off with Rs 5 lakhs or 10 lakhs. While such amounts may be necessary to build a strong core portfolio of stocks, you can always build up your capital through regular and systematic investing.

Whatever small amount that you can spare after meeting your regular monthly expenses can be invested in an index fund or diversified equity fund through the ups and downs of the stock market. After a few years of regular and disciplined investing, you may be surprised at the nice bundle you will accumulate.

You can then think of building a core portfolio of individual stocks – provided of course, that you have the time and inclination for doing the hard work involved in individual stock selection and monitoring. Otherwise, continue with your regular investment process.

I can’t ever become a Warren Buffett or Rakesh Jhunjhunwala

This is the lamest excuse of all. Every cricketer can’t be a Bradman or Tendulkar. Does that mean one shouldn’t aspire to be a Laxman or Dravid or Dhoni?

You can be what you want to be – but not without hard work and talent. No one ever became good at anything by taking short-cuts. If you want to become a trader because it involves less work and can give fast returns, you are being naive. You will end up being poor quickly. The majority of traders make their broker’s rich.

Another, often unstated, excuse is: Investing is boring; trading is thrilling. My response to that is – for thrills, visit a race course or a casino. At least the ambience will be enjoyable while you lose money!

Wednesday, October 20, 2010

Stock Chart Pattern: Akzo Nobel India (ICI India) – An Update

More than a year back (in Sep ‘09), I had analysed the chart pattern of ICI India – now renamed Akzo Nobel India. The stock had just broken above the resistance of the 550 level, after consolidating in a bullish ascending triangle pattern. The resistance level then turned into a support level for the next couple of months.

Dutch multinational Akzo Nobel, a world leader in specialty chemicals and coatings, bought ICI UK’s paints business two years back and became the new owners of ICI India. They took their time in consolidating the Indian business by selling off the remaining non-core subsidiaries and businesses. Only the starch business still remains.

The end result? A pure paints company, debt free with a cash kitty of nearly Rs 1000 Crores, ready to expand, acquire and take on the big boys like Asian Paints, Kansai Nerolac and Berger Paints.

The market has become aware that this former diversified subsidiary of a UK company with assorted unrelated businesses is about to transform itself into a growth-oriented and focussed paints and coatings company that can benefit from India’s infrastructure growth story.

Let us have a look at the 13 months bar chart pattern of Akzo Nobel India (formerly ICI India) and find out how the stock has fared, and what lies ahead:

ICI_Oct2010

The stock consolidated in a sideways band between 550 and 600 before breaking out in mid-Dec ‘09, and moved up to touch a high of 680 on Jan 22 ‘10.

Nothing much happened during the next four months, as the stock declined slowly down to the support of the 200 day EMA. While the MACD, RSI and slow stochastic drifted down with the stock, the OBV remained flat. The positive divergence gave a hint that accumulation was going on. Note the volume spikes while the stock was oscillating in the narrow space between the falling 20 day EMA and the flat 200 day EMA.

The inevitable happened in Jun ‘10. The Akzo Nobel India stock rose sharply from a low of 570 to 750, and then started a rally that culminated at the all-time high of 970 on Sep 21 ‘10. A gain of 70% in 4 months. There may not be a better example of the benefits of holding a fundamentally strong stock for the long-term.

Note that the MACD, RSI and slow stochastic made lower tops as the stock moved higher from Jun ‘10 to Sep ‘10. The negative divergences has caused a month-long bout of profit booking. The stock hit a low of 845 on Oct 18 ‘10 retracing 31% of the 400 points rise, and has dropped below the 50 day EMA. The 20 day EMA is about to do likewise.

The technical indicators are suggesting that the stock is oversold. The MACD is below the signal line and falling in negative territory. The space between the two lines is widening. The RSI and slow stochastic have both entered oversold zones. The slow stochastic can remain in the oversold zone for a while, but the RSI rarely spends much time in oversold territory.

But the most interesting is the OBV. It has remained flat while the stock fell from 970 to 845. Smart money is accumulating the stock, and the next price spurt could reach 4 digit territory.

Bottomline? The stock chart pattern of Akzo Nobel India (formerly ICI India) is taking a break in the midst of a major up move. Existing holders can remain invested with a stop-loss at 750. A drop below 845 can be used to add/enter. With reserves exceeding 25 times the equity capital of Rs 37 Crores, a bonus issue will not be surprising.

Tuesday, October 19, 2010

What is causing the volatility in the Sensex?

Of late, the Sensex movements have become very volatile. Some times the index is opening on the plus side and moving higher during the trading day, only to plummet rapidly towards close of trading. On other days, it is opening negative and moving down further, only to regain all its losses by the end of the day.

For small investors, such trading momentum swings can be very confusing. What should one do? What is causing the Sensex volatility, and when will such volatility come to an end? The short answer to the question is: uncertainty. When the causes of uncertainty are removed, and the market is back in a clear trend (whether up or down), the volatility tends to get reduced.

Most investors take short-term views. When they are not sure what is going to happen in the near future, they tend to trade on small spreads. A few paisas of profit, and a sell order goes out. A Rupee of loss, and they try to ‘average’ (which means buying more to reduce the ‘cost’ price). The index becomes volatile as a result.

What are the causes behind the current uncertainty? There are several of them, and these have been mentioned below. Some of them have been building up over the past few months. What was the trigger that suddenly made investors conscious of these uncertainty factors? You don’t need to be an Einstein to figure out the answer. It is the ‘magic’ figure of 20000.

Many investors remember what happened when the Sensex crossed 20000 in 2008. The index crashed by 60%. Will the Sensex behave in a similar fashion in 2010? Some point out that this time it is different. It is the early stage of a bull market with the economy on the upswing. In 2008, it was the tail end of a 5 years long bull market when economic activity had reached a peak.

Others point out that unknown stocks are hitting upper circuits, just like it did in 2008. Also, the huge Coal India IPO may drain out a lot of cash from the secondary market leading to a big fall, just like the Reliance Power IPO did in 2008. (Why any one would want to invest in a notoriously corrupt PSU is another question!)

Despite the best efforts of the RBI, inflation is refusing to come under control. That could mean more interest hikes, which would be negative for the stock markets. The FII inflows continue unabated, even while the DIIs are forced to sell big time due to redemption pressures from mutual funds investors. That is causing the Rupee to appreciate against the Dollar, which in turn, is making exports less competitive pricewise.

When the FIIs started their massive selling in 2008, the Sensex had dropped like a stone. In case they start to sell again, another huge crash may ensue. Because they are not selling, there has been no decent correction in the Sensex in more than a year. So, the continuous FII buying is causing uncertainty, and the FIIs not selling is also causing uncertainty!

Last, but not the least, is the uncertainty of the Q2 results. If the results turn out to be good, the Sensex must have already ‘discounted’ it, so there is not likely to be much upside. If they turn out to be less than expectations, the Sensex may drop.

Note that some of these are short-term uncertainties. The Coal India IPO will be over soon. So will Q2 results announcements. Any interest hike may happen within the next couple of weeks. Why bother about what may or may not happen in the near future? You’ll get to know about it soon enough.

Some say that increased volatility is a warning sign of a trend change. Others say that high volatility is a sign that stocks will rally. If you really believe that the Indian economy is growing, and will continue to grow in the future (even if not at the same rate), then 20000 will just be a milestone along the way. The index is likely to reach much higher levels.

It is the short-term investor sentiments of greed and fear that is causing the uncertainty and worry – and consequently, the index volatility. Take a long-term view – which gurus like Ben Graham and Warren Buffett have advised – and stay invested.

If you want to protect your profits, set stop-losses. When a stop-loss gets hit in an individual stock, sell or book partial profits depending on your risk tolerance and asset allocation plan.

Monday, October 18, 2010

Stock Index Chart Patterns – Dow Jones (DJIA) and FTSE 100 – Oct 15 ‘10

Dow Jones (DJIA) Index Chart

image

The Dow Jones (DJIA) index chart pattern closed above the 11000 mark all 5 days of the week, and touched an intra-day high of 11188 on Oct 13 ‘10. Still, the Apr ‘10 top of 11309 has remained elusive. It could be just a matter of time before the Dow reaches a new high. The index has been making a bullish pattern of ‘higher tops and higher bottoms’ since the Jul ‘10 low.

All three EMAs are moving up, with the index above them. Volumes have started to pick up a bit, but the highest volumes was on Friday, which was a ‘down day’. The technical indicators are hinting at a correction. The slow stochastic has dipped from the overbought zone and the %K line has moved below the %D. The MACD is positive and above the signal line, but has stopped rising. Both the RSI and MFI are above their 50% levels, but have made lower tops.

The Dow may be in the process of forming a bullish cup-and-handle pattern that could lead to a stronger rally. This article gives five reasons why the bull party may continue, despite the unexpected rise in unemployment claims. Any drop towards the rising 20 day EMA can be a good opportunity to add.

FTSE 100 Index Chart

image

The FTSE 100 index chart pattern is playing ‘follow the leader’ with the Dow. The index closed above the 5700 mark three days in a row, but the low volumes do not inspire much confidence. All three EMAs are moving up with the index above them. The bulls are gradually gaining the upper hand.

All four technical indicators have made lower tops as the FTSE continues to make higher ones. The negative divergences could lead to a correction down towards the 50 day EMA. The slow stochastic has dropped from the overbought zone. The MACD is positive and touching the signal line. The RSI is above the 50% level, but drifting down. The MFI is below the 50% level and falling.

Till the Apr ‘10 top of 5834 is crossed convincingly, the bears will try to fight back. Any drop below the 20 day EMA can be used to add.

Bottomline? The chart patterns of the Dow Jones (DJIA) and FTSE 100 indices are back in bull markets. The stuttering economic recoveries in the USA and UK are keeping bear hopes alive. Buy the dips, but select the stocks (or funds) carefully.

Sunday, October 17, 2010

Stock Index Chart Patterns – Hang Seng, Singapore Straits Times, Malaysia KLCI – Oct 15 ‘10

Hang Seng Index Chart

image

The Hang Seng index chart had appeared to make a bearish double-top pattern when I wrote a technical analysis of the Hong Kong stock index four weeks back. The technical indicators were supporting the bearishness with their negative divergences. But the volume and price action indicated otherwise, and I concluded that the Hang Seng index had returned to a bull market.

The index has soared by more than 8% in four weeks to touch a new two years intra-day high of 23867 on Oct 14 ‘10, before closing the week at 23758. The rise has been supported by a considerable pick up in volumes. All three EMAs are moving up with the index above them. The bulls are back in control.

The technical indicators are strongly bullish. The slow stochastic has stayed inside the overbought zone for a month. The MACD is positive and rising above the signal line, and made a new high. The ROC is rising in positive territory and also made a new high. The RSI is in the overbought zone but has made a lower top.

The only hope for the bears is that the Hang Seng has risen a bit too steeply, and is more than a 1000 points above the 20 day EMA. A possible correction, down to the 20 day EMA will not only be healthy for sustenance of the bull market, but will provide entry opportunities.

Singapore Straits Times Index Chart

image

Three weeks back, the Singapore Straits Times index chart was looking quite bullish but was facing a bit of profit booking after touching a 52 week high. The index has continued its bullish ‘higher tops and higher bottoms’ pattern and has since gained more than 110 points (3.5%), as it touched another new 52 week high of 3221.

The economy is back on track, and the technical indicators are reflecting the strength of the stock market. The slow stochastic is back in the overbought zone, after briefly dipping below. The MACD is positive and above the signal line. The ROC is positive, but failed to make a new high. The RSI is above the 50% level, but has made a lower top.

The negative divergences in the ROC and RSI may lead to some profit booking. Any dips can be used to add.

Malaysia KLCI Index Chart

image

The Malaysia KLCI index chart has been in a firm bull grip ever since it got support from the 200 day EMA back in May ‘10. When I analysed the chart four weeks back, the index was looking overbought and ripe for a correction. The advice to investors was:

‘A dip towards the 20 day EMA will provide entry opportunities, and fresh impetus to the bulls to take the index higher.’

The KLCI index did precisely that, dropping to the 20 day EMA on Sep 24 ‘10 before moving steadily upwards to touch a new high of 1501 on Oct 14 ‘10. Good volumes indicate that the bull market is sustainable. All three EMAs are moving up with the index above them.

The slow stochastic has re-entered the overbought zone after a dip below. The MACD is positive and touching the signal line, but made a lower top. The ROC is also positive but failed to make a new high. The RSI has risen sharply to the overbought zone, but also failed to make a new high. The negative divergences in the technical indicators may cause the KLCI index to drop to the 20 day EMA again.

Bottomline? The chart patterns of the Asian indices are in strong bull markets. The sporadic efforts of the bears to halt the bull charge is leading to small corrections that are aiding the bull resolve. Buy on dips, and hold with trailing stop-losses.

Friday, October 15, 2010

BSE Sensex and NSE Nifty 50 Index Chart Patterns – Oct 15, ‘10

BSE Sensex Index Chart

Sensex_Oct1510_6m

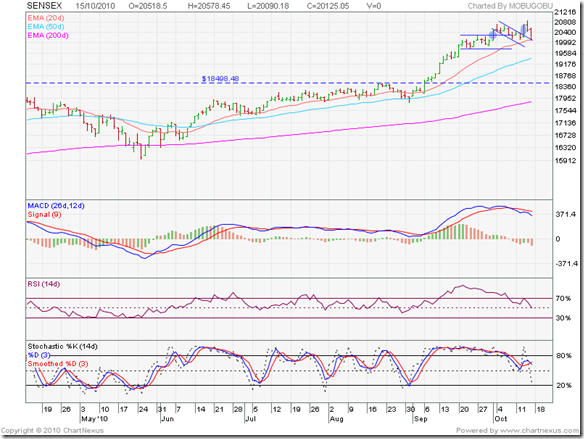
The BSE Sensex chart pattern broke out above the 18500 level in Sep ‘10 following a year-long consolidation and quickly touched the 20000 level. Eight sessions of sideways consolidation in a narrow band was followed by another upward break out (highlighted in blue) that touched a new high of 20707 – meeting the minimum upward target of 20600 from the break out level of 18500.

A small consolidation in a ‘flag’ pattern – the possibility of such a pattern was discussed in last Tuesday’s post – was followed by an upward break out (also highlighted in blue) that touched a new high of 20854 on Oct 14 ‘10.

A ‘reversal day’ pattern (higher high, lower close) led to two days of profit booking that brought the Sensex down to the twin support of the rising 20 day EMA and the top of the ‘flag’. Will the support hold, or will the Sensex drop some more?

That’s a good question, and only Mr. Market knows the answer. But we can always assess the bullish and bearish possibilities. First the bullish view.

The BSE Sensex index chart is poised just above the rising 20 day EMA. All three EMAs are moving up, indicating a bull market. The FIIs have been net buyers through out all the ups and downs in the index for the past few months. Recent restrictions in overseas fund inflows into many emerging markets (that have trade surpluses or marginal deficits with the USA) should lead to more FII money flows into India.

The reasonably successful conclusion of the Commonwealth Games, with India second in the medals tally, will bring India, Inc. greater attention from global investors. The CEO of Radisson Hotels said in a TV interview on CNN that in spite of the infrastructure gliches and bad publicity preceding the Commonwealth Games, he had no qualms about going ahead with his plans of opening 100 hotels in India by 2015!

Next, the bearish view – given below the analysis of the Nifty 50 chart.

NSE Nifty 50 Index Chart

Nifty_Oct1510_6m

The NSE Nifty 50 chart pattern looks almost identical to the BSE Sensex chart. Only the levels are different. The upward break out above the year-long consolidation channel occurred at 5550 in Sep ‘10. The index touched the 6000 level and entered a narrow sideways consolidation.

The break out from the ‘flag’ consolidation pattern touched a new high of 6284 on Oct 14 ‘10. Note that the ‘reversal day’ pattern was accompanied by good volumes – but not significantly higher volumes, which would have indicated buying exhaustion. 

In spite of a strong bullish case mentioned above, the technical indicators are not very supportive. The MACD is positive, but falling below the signal line. The RSI has dropped from the overbought zone down to its 50% level. The slow stochastic has also dropped from its overbought zone. It is above the 50% level but has given a bearish cross.

More importantly, all the three indicators are showing negative divergences. They made lower tops as the NSE Nifty 50 index made higher ones. The IIP numbers were a let down. Infosys Q2 results announced today were as per expectations, but the market was expecting a bonus issue while the company offered a special dividend.

Bottomline? The BSE Sensex and NSE Nifty 50 index charts are showing technical weakness caused by profit booking – mostly by domestic investors. The FIIs remain net buyers, and they have deep pockets. On the downside, expect support from the bottom of the narrow sideways trading band and the rising 50 day EMA. A drop below the 50 day EMA may provide opportunities to enter individual stocks. Stay invested. There are no signs of a trend change yet.