Monday, June 30, 2014

Stock Index Chart Patterns: S&P 500 and FTSE 100 – Jun 27, ‘14

S&P 500 Index Chart

S&P 500_Jun2714

The 6 months daily bar chart pattern of S&P 500 touched another new intra-day high of 1968 on Tue. Jun 24. However, formation of a ‘reversal day’ pattern (higher high, lower close) led to a quick drop to test support from the rising 20 day EMA.

By Fri. Jun 27 the index recovered to close almost flat for the week. All three EMAs are rising and the index is trading above them in a long-term bull market. Despite the weak GDP number, the relentless rise of the index continues.

Technical indicators have corrected overbought conditions, but remain in bullish zones. MACD has slipped down from its overbought zone, and crossed below its signal line. RSI and Slow stochastic are just below their respective overbought zones.

All three indicators are showing negative divergences by failing to touch new highs with the index. Some consolidation or correction is a possibility. Use the likely dip to add, or hold with a trailing stop-loss.

FTSE 100 Index Chart

FTSE_Jun2714

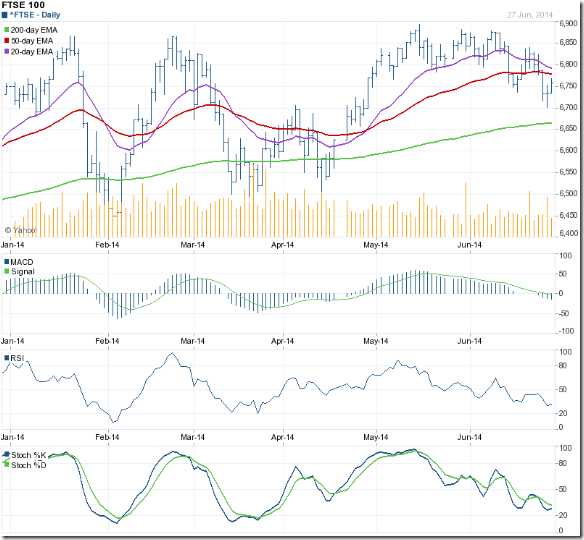
The 6 months daily bar chart pattern of FTSE 100 had pulled back sharply after breaking down from a ‘symmetrical triangle’ pattern. In last week’s analysis it had appeared that the break down was a ‘false’ one, and bulls were reasserting themselves, as the index closed the week above all three EMAs.

However, the index was still in a bearish ‘lower tops - lower bottoms’ pattern, and the following cautionary remark was added: “…the top of 6895 touched on May 15 ‘14 needs to be crossed before bulls can regain complete control.”

Bears were not in a mood to give up, and struck swiftly. The index dropped to the 6700 level before recovering to close above the 6750 level, but below its 20 day and 50 day EMAs for the week.

Technical indicators are looking bearish. MACD is falling below its signal line in negative territory. RSI and Slow stochastic are just above their respective oversold zones. A test of support from the rising 200 day EMA may be in the offing.

Sunday, June 29, 2014

BSE Sensex and NSE Nifty 50 index chart patterns – Jun 27, 2014

The general election results spurred the stock market to new lifetime highs. Annual results of India Inc. are done with. The wheat has been separated from the chaff. The usual culprits – FMCG, Pharma, IT, private banks – have been at the forefront.

The next trigger for the market will be the budget. FIIs are keeping their wallets in their pockets till they hear clear announcements on retrospective taxation (a la Vodafone) and FDI norms. If the government delivers on its promises, another wave of foreign funds will flow in.

Both Sensex and Nifty have traded in consolidation patterns for the past three weeks. The indices touched new lifetime highs, but have not accelerated away – giving good opportunities for accumulating fundamentally strong stocks.

BSE Sensex index chart

Sensex_Jun2714

Sensex has been consolidating within a ‘flag’ pattern for the past three weeks. The pattern that had looked like a ‘falling wedge’ earlier, has been redrawn as a ‘flag’. Both patterns have bullish implications. An upward break out is likely.

Note that the index has been receiving support from its 20 day EMA (within the ‘flag’) for the past two trading sessions. A bounce up from here can breach the upper boundary of the ‘flag’.

Technical indicators are looking bearish. MACD is positive, but falling below its signal line. RSI and Slow stochastic are sliding below their respective 50% levels. ROC is indicating some bullishness by trying to emerge from negative territory.

The consolidation within the ‘flag’ may continue a bit longer. The back-to-back consolidations within a ‘symmetrical triangle’ and a ‘flag’ has helped improve the technical ‘health’ of the chart. They also provided opportunities to enter.

NSE Nifty 50 index chart

Nifty_Jun2714_LT

The weekly bar chart pattern of Nifty has been trading within a bullish ‘flag’ pattern for the past three weeks, from which the likely break out is upwards. As mentioned in last week’s update, a new up trend line has been drawn by connecting the Aug ‘13 and Feb ‘14 lows.

The long-term up trend line (from the Dec ‘11 low) has lost its near-term relevance because Nifty is trading too far above it. This new trend line – currently located between the 20 week and 50 week EMAs will guide the next leg of the up move.

Despite the consolidation, weekly technical indicators have remained within their respective overbought zones - except ROC, which has crossed below its 10 week MA and is just below is overbought zone. Remember that a market can stay overbought (or oversold) for long periods.

Bottomline? Chart patterns of BSE Sensex and NSE Nifty indices are continuing their consolidations within bullish ‘flag’ patterns, after touching new lifetime highs. Bull market corrections/consolidations provide adding opportunities. Choose stocks that have provided consistent and steady returns instead of seeking mythical multibaggers.

Saturday, June 28, 2014

Stock Index Chart Patterns: CAC 40, DAX, RTS – Jun 27, ‘14

CAC 40 Index Chart (France)

CAC_Jun2714

The following comments were made in last week’s analysis of the 6 months daily bar chart pattern of CAC 40: “The index rose to touch a lower top of 4582 on Thu. Jun 19, and dropped to a marginally lower close for the week. The lower top leaves the door open for a continuation of the corrective move next week.”

The index dropped below its 20 day and 50 day EMAs into the support zone between 4420-4500. Despite an intra-day breach of 4420 on Thu. Jun 26, the support zone should prevent a deeper fall.

Technical indicators are looking bearish, and a bit oversold. MACD has entered its negative zone, and is falling below its signal line. RSI is just above the edge of its oversold zone, but its fall has stalled. Slow stochastic has entered its oversold zone.

In case bear selling overwhelms the bulls, expect much stronger support from the 4350 level. The index is trading well above its rising 200 day EMA. The long-term bull market is under no threat. The correction is providing an opportunity to add.

On longer term weekly chart (not shown), the index is receiving support from its 20 week EMA.

DAX Index Chart (Germany)

DAX_Jun2714

In last week’s analysis of the 6 months daily bar chart pattern of DAX, there were some bearish signals: the index formed a ‘shooting star’ candlestick pattern supported by highest volumes in 9 months, and also formed a ‘broadening top’ pattern.

The combination was a recipe for reversal of the up trend. So far, the index has corrected only 2% from its top of 10051, and has received good support from its 50 day EMA and the support zone between 9600–9800 (mentioned two weeks back). The long-term bull market is under no threat as yet.

Technical indicators are looking bearish. MACD is positive, but falling below its signal line. RSI has dropped below its 50% level. Slow stochastic has moved down to the edge of its oversold zone. Expect some more correction or consolidation.

The correction is providing an adding opportunity. But maintain a stop-loss at 9300.

RTS Index Chart (Russia)

RTSI_Jun2714

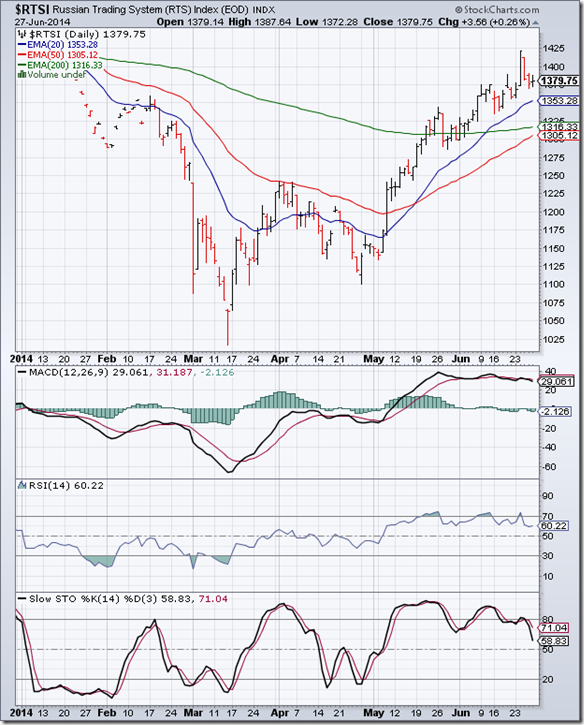
The 6 months daily bar chart pattern of RTSI continued its rally, rising to touch a new high just short of 1425. The index could not sustain above the 1400 level for long, but closed the week with a gain of 21 points.

The rising 50 day EMA is on the verge of crossing above the 200 day EMA. The ‘golden cross’ will technically confirm a return to a bull market.

Technical indicators are correcting overbought conditions, but remain in bullish zones. However, all three continue to show negative divergences by failing to touch new highs with the index. A correction may be just around the corner.

On longer term weekly chart (not shown). the index is trading above its 20 week and 50 week EMAs but facing resistance from its 200 week EMA. Technically, the long-term bear market isn’t over yet.

Only a strong move above the 200 week EMA and the Oct ‘13 top of 1525 will break the bearish pattern of lower tops and lower bottoms. Looks like bulls have their work cut out.

Wednesday, June 25, 2014

Why subsidies need to be curtailed and targetted – a guest post

The increases in railway passenger fares and freight charges have come at an inopportune time. Though necessary to improve the precarious financial condition of Indian Railways, the raising of charges a few days before the Railway budget has caused a furore.

Political parties of all hues have taken to the streets and blocked trains to protest the fairly steep hike in charges. Already, the government seems to be back-tracking, and there is talk about implementing the proposed increase in phases instead of in one go.

In this month’s guest post, Nishit argues that all subsidies need to be curtailed, and better targetted at the financially weaker sections of society. Incidents of subsidised LPG for domestic consumption being diverted to commercial enterprises, expensive fuel-guzzling SUVs using subsidised diesel, MNREGA funds filling politicians’ pockets prove his case.

------------------------------------------------------------------------------------------------------------------------------------------

The Rail subsidies are being whittled away. Read my last post:

http://money-manthan.blogspot.in/2014/06/bold-and-welcome-move-by-goverment.html

Let us go into subsidies and what they mean. Subsidies are basically grants from the Government that allows financially weaker sections of the population to live a decent life with dignity. That should be the only guiding principle of subsidies. Over a period of time, that meaning got lost and it became an entitlement raj. Everyone and his grandfather queued up for subsidy. Where does the subsidy money come from? It comes from the revenue collected by the government. So, ultimately funds meant for development go towards subsidies and we are left with poor infrastructure.

LPG subsidy for 12 cylinders in a year means that a family of six consumes 1 cylinder every month and government bears a loss of Rs 5oo per cylinder. That translates to Rs 6000 ‘free lunch’ per year. If there are six members in a family at least two will be earning. If the entitlement of subsidised cylinders was reduced to 6 per year, there will be a straight 50% subsidy cut. That means a saving of Rs 3000 per year per LPG connection.
Same goes for petrol and diesel. The argument is: diesel is subsidised otherwise inflation will go up. Once market rates become effective it cannot go up infinitely. Over Rs 1 lakh Crores saved on subsidies can be used to build better roads, thus giving productivity gains. Classic example is truck drivers using expressways across the country. Earlier they could make 4 trips, now they make say 7 trips thanks to new trucks and better roads. The extra money spent is earned back multifold.

Now, take the MNREGA scheme. People are paid for a minimum of 100 days of labour. There is no accountability for what kind of work is done and who does them. If people were trained to work as road labourers, paid more, one could get the roads built and the people gain a skill. They would be able to get a job in the private sector building roads.

There is a saying: teach a man to fish and you feed him for life, give him fish to eat and you feed him for a day.

Rail subsidies operate in the same way. If the railway earns a rupee it spends almost 90 paisa on salaries and just to maintain status quo. Where is the money to invest in Infrastructure?

Summing up, subsidies are not bad in principle. They are essential to protect the financially weaker sections of society. The target audience needs to be clearly identified. Otherwise, financially well-off people enjoy subsidies not meant for them.

Tailpiece: Looking at the subsidy ‘gift’, I switched from a Petrol car to a Diesel car last year. My running cost per Kilometer has dropped from Rs 8 to Rs 4. I rest my case.

------------------------------------------------------------------------------------------------------------------------------------------

(Nishit Vadhavkar is a Quality Manager working at an IT MNC. Deciphering economics, equity markets and piercing the jargon to make it understandable to all is his passion. "We work hard for our money, our money should work even harder for us" is his motto.

Nishit blogs at Money Manthan.)

Tuesday, June 24, 2014

WTI and Brent Crude Oil charts: an update

WTI Crude chart

WTI Crude_Jun2314

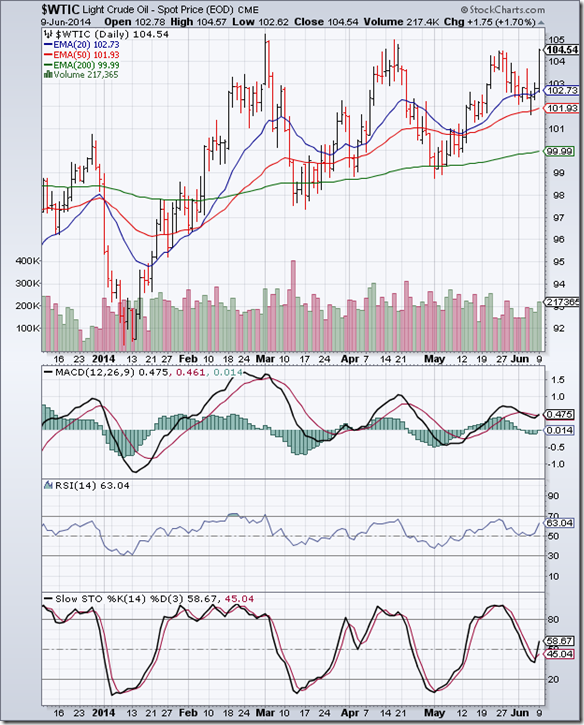
In a previous post on the 6 months daily bar chart pattern of WTI Crude oil, technical indicators had turned bullish, suggesting a possible upward breach of the 105 level. It was also mentioned that 105-108 was a resistance zone.

Note that oil’s price convincingly breached the 105 level with a sharp increase in volumes on Jun 12 ‘14. After moving up to test the 108 level the next day, oil’s price has been consolidating within the resistance zone between 105-108.

Failure to breach the 108 level may enthuse bears to become active. Technical indicators are in bullish zones after correcting overbought conditions. The consolidation may continue a bit longer.

Why did oil’s price fail to move above the 108 level? Fundamentalists(!) may argue that Iraq’s oil production has not been affected yet due to the sectarian conflict. So, there was no impetus for bulls to hold on to their long positions. Chartists(?) will say that resistance zones have a tendency to stall bull rallies.

On longer term chart (not shown), all three weekly EMAs are rising and weekly technical indicators are in bullish zones. Oil’s price is trading in a long term bull market.

Brent Crude chart

BrentCrude_Jun2314

In the previous post on the 6 months daily bar chart pattern of Brent Crude oil, technical indicators were beginning to turn bullish after a correction, and on long-term weekly chart oil’s price was trading in a bull market.

That can hardly explain the sharp price spike on huge volumes that occurred on Jun 12 ‘14. Obviously, bull speculators had a field day using the turmoil in Iraq as an excuse. Oil’s price continued to surge past previous resistance levels of 113 and 115 before halting just short of 116.

All three technical indicators – MACD, RSI, Slow stochastic – had become overbought, and have started correcting. Oil’s price may drop down to 112.

On longer term chart (not shown), oil’s price is trading above its three weekly EMAs, and weekly technical indicators are in bullish zones. The long-term bull market is alive and kicking.

Monday, June 23, 2014

Stock Index Chart Patterns: S&P 500 and FTSE 100 – Jun 20, ‘14

S&P 500 Index Chart

S&P 500_Jun2014

The 6 months daily bar chart pattern of S&P 500 rose to touch new intra-day and closing highs on Fri. Jun 20 ‘14, supported by a huge spike in volumes. Bulls shook off a weak bear attack in the wake of the turmoil in Iraq like water off a duck’s back.
All three technical indicators have re-entered their respective overbought zones, and showing negative divergences by failing to touch new highs with the index. One must remember that markets can remain overbought (or oversold) for long periods.

That doesn’t mean caution should be thrown to the winds. Bears tend to get active at or near lifetime highs. Stay invested. Maintain a trailing stop-loss to protect profits, and enjoy the ride.

On long-term weekly chart (not shown), all three weekly EMAs are rising and the index is trading above them in ‘blue-sky’ territory with no known resistances. Next target 2000? Expect some selling there.

FTSE 100 Index Chart

$FTSE_Jun2014

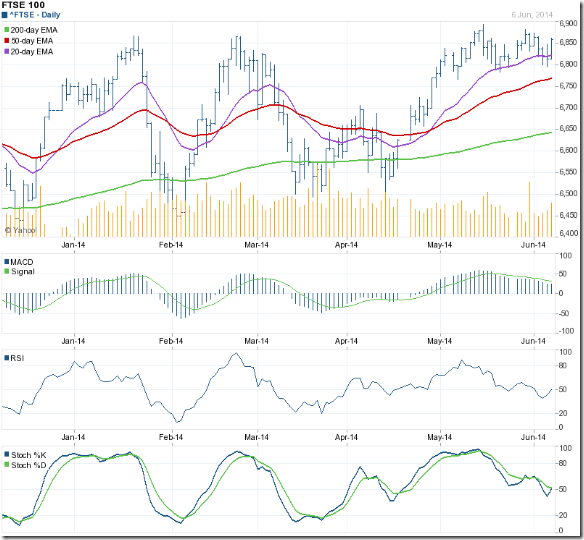
The 6 months daily bar chart pattern of FTSE 100 had broken down below a ‘symmetrical triangle’ pattern – as mentioned in last week’s post – and was expected to correct some more. After correcting down to 6736 on Tue. Jun 17 ‘14, the index turned around and closed the week above all three EMAs and the 6800 level.

Was the downward break out from the ‘ symmetrical triangle’ a ‘false’ one? It would appear so. Significantly strong volumes on Fri. Jun 20 ‘14 (not shown on chart) means the bulls are reasserting themselves. However, the top of 6895 touched on May 15 ‘14 needs to be crossed before bulls can regain complete control.

Technical indicators are beginning to turn bullish. MACD is below its falling signal line, but is turning up after barely slipping into negative territory. RSI has crept above its 50% level. Slow stochastic bounced up from its oversold zone and has almost reached its 50% level.

On longer-term weekly chart (not shown), the index took support from its 20 week EMA, and is trading above all three weekly EMAs in a bull market.

Sunday, June 22, 2014

BSE Sensex and NSE Nifty 50 index chart patterns – Jun 20, 2014

Stock market players – investors, brokers, analysts, funds – have finally agreed that a bull market is in progress. Some are calling it a ‘new’ bull market; others are still hedging their bets and calling it ‘the cusp’ of a bull market. So, Sensex and Nifty should be moving up, right?

Instead, both indices closed lower for the second straight week. What is going on? Anticipation of an NDA-led government, and its confirmation after the elections had changed market sentiment from mildly bullish to strongly bullish. That led to sharp up moves on both indices.

The market became ‘overbought’ technically, and required some correction or consolidation for restoring its technical ‘health’. Such corrections or consolidations in bull markets are necessary for the indices to gather ‘energy’ for the next up move, and provide entry or adding opportunities.

BSE Sensex index chart

SENSEX_Jun2014

Three bearish signals were mentioned in last week’s analysis of the daily bar chart pattern of Sensex. The first – a likely ‘false’ upward break out from the consolidation within a symmetrical triangle – has turned out to be a bullish signal. The index is consolidating within a ‘falling wedge’ pattern from which the break out should be upwards.

The other two bearish signals – widening gap between the 50 day and 200 day EMA, and increasing downward momentum of the technical indicators – are still visible. The consolidation within the ‘wedge’ may continue next week, which is also F&O expiry week.

All four technical indicators have corrected from their respective overbought zones. ROC has dropped into bear territory below its ‘0’ line. The other three are still in bullish zones, but falling. Use the index slide to accumulate good stocks.

What about the trouble in Iraq that has led to higher oil prices? It did dampen bullish sentiments, and perhaps caused the consolidation within the ‘wedge’. Some times, an overbought market just needs an excuse to correct or consolidate. The long-term bull market is intact.

NSE Nifty 50 index chart

Nifty_Jun2014

As expected, the weekly bar chart pattern of Nifty started to correct after touching a new lifetime high of 7700 and forming a ‘reversal week’ pattern (higher high, lower close) in the previous week.

Weekly technical indicators are still in their respective overbought zones. ROC has just crossed below its 10 week MA. RSI is drifting down. But MACD and Slow stochastic are moving up. The conflicting signals are suggesting that the correction may not last long.

The long-term up trend line (marked 1-1) seems to have lost its near-term relevance, as Nifty is trading more than 1500 points above it. A new up trend line from the Aug ‘13 low (marked 2-2) has been drawn. Henceforth, the new up trend line will be treated as the next leg of the bull market.

Bottomline? Chart patterns of BSE Sensex and NSE Nifty indices are consolidating after touching new lifetime highs. Bull market corrections/consolidations provide adding opportunities. Choose stocks that are steady compounders rather than ‘rockets’ that move up sharply and then fall just as rapidly. The name of the game is ‘preservation of capital’.

Saturday, June 21, 2014

Stock Index Chart Patterns: CAC 40, DAX, RTS – Jun 20, ‘14

CAC 40 Index Chart (France)

CAC_Jun2014

The 6 months daily bar chart pattern of CAC 40 dropped below its 20 day EMA and closed at 4510 on Mon. Jun 16. The next day, the index touched an intra-day low of 4508 – just above the support zone between 4420-4500 mentioned in last week’s post – but bounced up to close above its 20 day EMA.

The index rose to touch a lower top of 4582 on Thu. Jun 19, and dropped to a marginally lower close for the week. The lower top leaves the door open for a continuation of the corrective move next week.

Technical indicators are in bullish zones, but looking weak. MACD is sliding below its signal line in positive territory. RSI bounced up from its 50% level, but is again falling towards it. Slow stochastic bounced up sharply after dropping below its 50% level, but its upward momentum is stalling.

The index is in a long-term bull market. Corrections provide adding opportunities.

DAX Index Chart (Germany)

DAX_Jun2014

The 6 months daily bar chart pattern of DAX has some good news for the bulls and some bad news. First, the good news:

Technical indicators in last week’s chart had suggested a continuation of the correction. Instead, the index took support from its 20 day EMA, and formed a higher bottom and higher top pattern for the week. The index touched a new intra-day high of 10051 on Fri. Jun 20, but closed at the lowest point of the day. However, it gained back its previous week’s loss.

Now, the bad news. The index formed a ‘shooting star’ pattern (in candlestick parlance) supported by highest volumes in 9 months (not shown on chart). The combination of the two can lead to a possible reversal of the up trend. Another pattern visible is a ‘broadening top’ (higher tops, lower bottoms), which has bearish implications.

Technical indicators are in bullish zones, but showing negative divergences by failing to touch new highs with the index. One of the lessons learnt the hard way (i.e. by losing money) is never to short a bull market. However, partial profit booking near a new high may be a prudent move.

RTS Index Chart (Russia)

RTSI_Jun2014

The 6 months daily bar chart pattern of RTSI traded in bull territory throughout the week (i.e. above its gently rising 200 day EMA), touching an intra-day high of about 1390 on Thu. Jun 19, but closed 16 points lower for the week.

The 20 day EMA has crossed above the 200 day EMA, indicating short-term bullishness. However, though rising, the 50 day EMA is still below the 200 day EMA. So, the technical confirmation of a bull market is still awaited.

Technical indicators are in bullish zones, but showing negative divergences by touching lower tops. The index is likely to undergo some correction or consolidation.

Friday, June 20, 2014

Technical update – 6 Housing Finance stocks

During the past couple of years, high interest rates, slow economic growth and inflation took a huge toll on the performance of most companies in general, and rate-sensitive companies in particular.

Commercial real estate business took a beating. Even residential real estate business suffered. So, it is no surprise that housing finance companies felt the heat of the slowdown.

However, there are always one or two companies in each sector that manage to stand out from the rest due to their transparency and efficiency of operations. Those are the companies that long-term investors should consider including in their portfolios. 

Can Fin Homes

CanFinHomes_Jun1914

The stock price of CanFin Homes was drifting sideways around the 105 level before rising sharply to touch a high of 182 in Jan ‘13. It then entered a year-long period of consolidation, forming a bullish ‘saucer’ pattern that touched a low of 114 in Aug ‘13.

After completing the ‘saucer’, the stock price rose quickly to touch a high of 365 earlier this month – gaining a huge 220% in less than a year. Such a sharp up move is difficult to sustain. The stock appears to be forming a head-and-shoulders reversal pattern that can drop it below 300 to its 50 day EMA, or even lower.

Dewan Housing Finance

DewanHsgFin_Jun1914

Dewan Hsg Fin stock formed a small double-top reversal pattern at 220 in Jan ‘13, and dropped all the way to 103 in Sep ‘13 – losing more than 50% from its high. A ‘V’ shaped recovery took the stock price to a new high of 237 in Jan ‘14. The stock regained all its losses over the previous 9 months in 4 months to enter a bull market.

Three months of sideways consolidation was followed by a sharp rally to a high of 373 earlier this month – a gain of more than 250% from its low. The stock appears to be forming a head-and-shoulders reversal pattern that can drop it to 250 or lower. Note that RSI has completed a head-and-shoulders pattern, and Slow stochastic has formed a double-top pattern. ROC touched a much lower top.

GIC Housing Finance

GICHsgFin_Jun1914

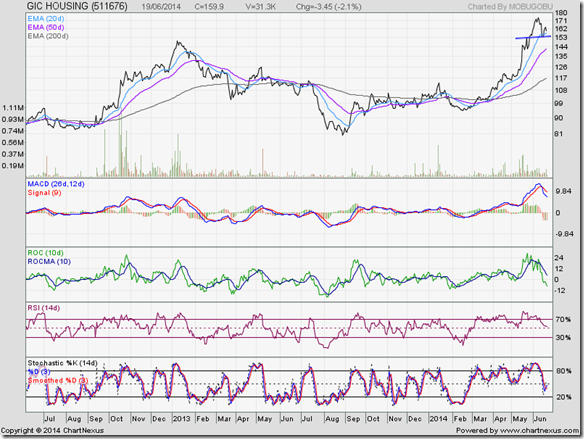
The stock of GIC Hsg Fin touched a high of 149 in Jan ‘13 and a low of 80 in Aug ‘13. For the next 7 months, the stock struggled to return to bull territory before finally managing to do so in end-Mar ‘14. The subsequent rally was swift.

The stock price touched a new high of 174 earlier this month – more than doubling from its Aug ‘13 low – but overbought conditions led to a correction down to 154, where it is trying to find a bottom. If 154 gets breached, the stock may drop to 140.

GRUH Finance

GruhFin_Jun1914

The price chart of Gruh Fin is a clear stand-out. It has been in a bull market right through the slowdown. Note that during a 13 months long sideways consolidation within a ‘rectangle’ pattern, the 200 day EMA kept rising – indicating that the eventual break out from the ‘rectangle’ would be upwards.

Rectangles are usually continuation patterns, but tend to be unreliable. So, it is better to wait for the break out. Note that the break out in end-Dec ‘13 was followed by a pullback to the top of the ‘rectangle’ a month later. The subsequent parabolic rally touched a high of 203 (adjusted for bonus and split). The stock is undergoing correction, and may drop to 180.

HDFC

HDFC_Jun1914

HDFC stock is a favourite of FIIs, and has been in a bull market technically despite a sharp drop from a high of 924 (in May ‘13) to 654 (in Aug ‘13). Note that the stock price drops below its 200 day EMA periodically – providing adding opportunities.

After touching a new high of 978 earlier this month, the stock is correcting a bit. Being a large-cap and FII-owned company, it does not give spectacular returns like a small-cap or mid-cap company, but is one of the best stocks to own because of its transparency and consistent performance year after year.

LIC Housing Finance

LICHsgFin_Jun1914

Though a favourite of many small investors, the chart of LIC Hsg Fin doesn’t inspire confidence. From a high of 295 (in Jan ‘13), the stock dropped to 157 (in Aug ‘13). After forming a small double-bottom reversal pattern, the stock price struggled for the next 6 months to enter bull territory.

Once it broke out above all three EMAs in Mar ‘14, it rose rapidly to touch 345 earlier this month, but seems to be forming a head-and-shoulders reversal pattern. The downside target is 280.

All 6 stocks are undergoing bull market corrections, which means they are providing adding opportunities. But please don’t forget to do your due diligence before deciding to buy/sell.

Wednesday, June 18, 2014

Nifty chart: a mid-week update (Jun 18 ‘14)

The higher WPI inflation number was a fly in the ointment. Any interest rate cut by RBI will need to wait. A delayed and possibly deficient monsoon due to El Nino effect is another concern.

The insurgency in Iraq could be a potential game changer if the oilfields in the south fall into rebel hands. Oil prices have already spiked up, and that will widen the current account deficit.

There are rumours of an alliance between Iran and USA to thwart the ISIS rebels in Iraq. Just a few months back, USA tried to pressurise India to curtail relations with Iran. No wonder American writer Charles D. Warner had said: “Politics makes strange bedfellows”.

Nifty_Jun1814

The clear majority of the Modi-led NDA in the recent elections has boosted bullish sentiments to such an extent that Nifty is forming one bullish pattern after another even when bad news hits the market.

The upward ‘gap’ formed on May 13 ‘14 remains unfilled. Above it is a bullish ‘flag’ pattern - a period of consolidation after the huge intra-day gyrations on election results day (May 16 ‘14).

A break out above the ‘flag’ has been followed by another consolidation within a likely ‘falling wedge’ pattern that has bullish implications.

The bad news for bulls is that today’s close is lower than the intra-day high touched on May 16 ‘14. In other words, the Nifty has made zero gain in the past month.

The good news is that overbought conditions have largely dissipated – as visible on the technical indicators. MACD is still inside its overbought zone, but has started sliding and has crossed below its signal line. ROC is falling below its 10 day MA in positive zone. RSI has moved up to the edge of its overbought zone after falling from it. Slow stochastic has slipped down from its overbought zone.

A likely upward break out from the wedge should propel the index towards 8000. Interestingly, FIIs and DIIs were both net buyers today, but the index dropped on strong volumes.

All three EMAs are rising and Nifty is trading above them in a long-term bull market. Stay invested. Use dips to add. Book profits in mid-cap and small-cap stocks that have risen sharply.

Tuesday, June 17, 2014

Gold and Silver charts: an update

Gold Chart Pattern

Gold_Jun1614

The following remarks in the previous post on gold’s daily bar chart pattern are worth repeating: “Looks like gold’s price is trying to find a bottom at 1240, from where it may attempt a pullback towards the 1260-1280 zone. If the zone now turns into a resistance zone, which it should, then the pullback may be short-lived.”

Note that gold’s price bounced up from the 1240 level, as expected, and entered the zone between 1260-1280. Yesterday, it briefly breached the 1280 level and the 50 day EMA intra-day, but formed a ‘reversal day’ pattern (higher high, lower close) and dropped back inside the 1260-1280 zone.

Has the rally ended? It would seem so. The turmoil in Iraq had been a trigger for the rise in the prices of oil and gold. As the progress of the Sunni rebels towards Iraq’s main oil fields down south has stalled, bullish speculative positions are likely to get squared off.

Technically, the indicators are giving mixed signals. MACD has crossed above its signal line in negative zone, but its upward momentum is slowing down. RSI is resting at its 50% level after briefly moving above it. Slow stochastic has risen sharply above its 50% level into bullish zone.

After touching a high of 1395 in Mar ‘14 and forming a ‘reversal day’ pattern, gold’s price has been in a down trend (lower tops and lower bottoms), and has been trading below its falling 200 day EMA for the past three months.

On longer term weekly chart (not shown), gold’s price faced resistance from its 20 week EMA and is trading below all three weekly EMAs in a bear market.

Silver Chart Pattern

Silver_Jun1614

Two weeks ago, silver’s price had closed at 18.75, from where an upward bounce was expected. Why? Because it had twice provided support at the same level earlier – indicating that bulls were likely to defend the level.

The expected bounce turned into a sharp bear market rally on strong volumes that propelled silver’s price above its 20 day and 50 day EMAs. However, the rally appears to have stalled short of its May ‘14 top of 20.

Daily technical indicators are looking bullish. MACD has risen sharply above its signal line, and is about to enter positive territory. Slow stochastic had a steep climb to enter its overbought zone. RSI is above its 50% level, but beginning to turn down.

The price band between 20-20.50 is a resistance zone. Bears are likely to become active should silver’s price attempt to move up higher.

On longer term weekly chart (not shown), silver’s price faced resistance from its 20 week EMA and is trading below all three weekly EMAs in a bear market.

Subhankar blogs at investmentsfordummieslikeme.blogspot.com

You can contact him at mobugobu@yahoo.com, and follow him at twitter @mobugobu

Monday, June 16, 2014

Stock Index Chart Patterns: S&P 500 and FTSE 100 – Jun 13, ‘14

S&P 500 Index Chart

S&P 500_Jun1314

In last week’s analysis of the 6 months daily bar chart pattern of S&P 500, the following comments gave adequate warning to investors: “Technical indicators have been ‘flashing red’ for a while, with all three inside their overbought zones. Volumes have been moderate and sliding. The index is trading more than 40 points above its 20 day EMA. The vertical distance between the 50 day and 200 day EMAs is increasing. All of the above point to an overbought market that is ripe for a correction.”

The index rose to touch a new high of 1955 on Jun 9, but corrected down to 1925 over the next three days before bouncing up a bit on Jun 13. Though the index lost only 13 points on a weekly closing basis, on the weekly chart (not shown) a ‘key reversal bar’ (higher high, lower close) has formed.

Weekly volumes were strong but not significantly higher. That means the correction may not be very deep. There is good support in the zone between 1850-1900.

Technical indicators have corrected from overbought zones, but remain bullish. MACD has dropped to touch its signal line near the lower edge of its overbought zone. RSI and Slow stochastic have fallen sharply from their overbought zones, but remain above their respective 50% levels.

The turmoil in Iraq was just an excuse for some profit booking. The ongoing correction should improve the technical ‘health’ of the long-term bull market, and is providing an opportunity to add.

FTSE 100 Index Chart

FTSE_Jun1314

The 6 months daily bar chart pattern of FTSE 100 was consolidating sideways within a ‘symmetrical triangle’ pattern after touching a high of 6895 on May 15. Last week’s comments about the triangle pattern may be worth repeating: “Triangles tend to be continuation patterns, so the eventual break out should be upwards. However, triangles are unreliable. So, it is better to wait for the eventual break out before taking a buy/sell decision.”

The index continued its consolidation within the triangle from Monday through Thursday, but broke down sharply below the triangle and the 50 day EMA on Fri. Jun 13. Will the index correct some more?

Technical indicators are turning bearish. MACD is falling below its signal line in positive territory. Both RSI and Slow stochastic have slipped below their 50% levels into bearish zones.

The index is trading well above its rising 200 day EMA – so , the long-term bull market is under no immediate threat. The correction is providing an adding opportunity.

Bottomline? Daily bar chart patterns of S&P 500 and FTSE 100 are undergoing corrections in long-term bull markets after touching new highs. Stay invested or use the dips to buy.

Sunday, June 15, 2014

BSE Sensex and NSE Nifty 50 index chart patterns – Jun 13, 2014

An external event has dampened bullish market sentiments. The turmoil in Iraq has caused oil prices to rise, which will affect India’s current account deficit and inflation – putting paid to any hopes of an interest cut by RBI in the near term.

So far, the oil price rise is merely speculative as Iraq’s major oil fields are in the southern part of the country where the Sunni rebels are yet to gain control. It is unlikely that the western countries will sit back and let these oil fields fall into the hands of rebels.

However, it has provided bears with an opportunity to get back in the game. In last week’s analysis, overbought conditions and negative divergences visible on daily and weekly technical indicators had provided advance warning of corrections in both Sensex and Nifty indices.

BSE Sensex index chart

SENSEX_Jun1314

Some bearish signals are visible on the daily bar chart pattern of Sensex:

  1. The upward break out from the symmetrical triangle was expected to be followed by a pullback towards the top of the triangle. Instead, it is looking like an ‘end run’ (‘false’ break out) that may drop the index below the triangle
  2. The vertical distance between the 50 day EMA and 200 day EMA has reached 2000 points. It has been observed that a major correction often follows such a condition.
  3. All four technical indicators have started correcting overbought conditions. Though still in bullish zones, their downward momentum is increasing.

There is a possibility of the index dropping down to fill the ‘gap’ formed on the chart on May 13 ‘14. Contrary to popular belief, a part or complete filling of the ‘gap’ has bullish implications. The index is expected to resume its up move subsequently.

Note that the long-term bull market is intact. That means any correction may be used as an adding opportunity. Should you short the index? You may, if you are a short-term trader. But long-term investors should stay long. However, profits can be booked in small-cap and mid-cap stocks that have risen sharply.

NSE Nifty 50 index chart

Nifty_Jun1314

The weekly bar chart pattern of Nifty has formed a ‘reversal week’ pattern (higher high, lower close) after touching a new lifetime high. That has bearish implications. Note that a similar pattern was formed two weeks back, but with a difference. The index didn’t touch a new high then.

Weekly technical indicators are in their respective overbought zones, but beginning to correct. MACD is still moving up, but its upward momentum is slowing down. ROC has started to slide down to its rising 10 week MA. RSI and Slow stochastic have started moving down.

Nifty is still trading 10% above its 20 week EMA, and needs to correct some more to restore the technical ‘health’ of the chart.

Bottomline? Chart patterns of BSE Sensex and NSE Nifty indices have started correcting after touching new lifetime highs. Bull market corrections provide adding opportunities. But don’t jump in feet first. Be cautious, and very selective.

Saturday, June 14, 2014

Stock Index Chart Patterns: CAC 40, DAX, RTS – Jun 13, ‘14

CAC 40 Index Chart (France)

CAC_Jun1314

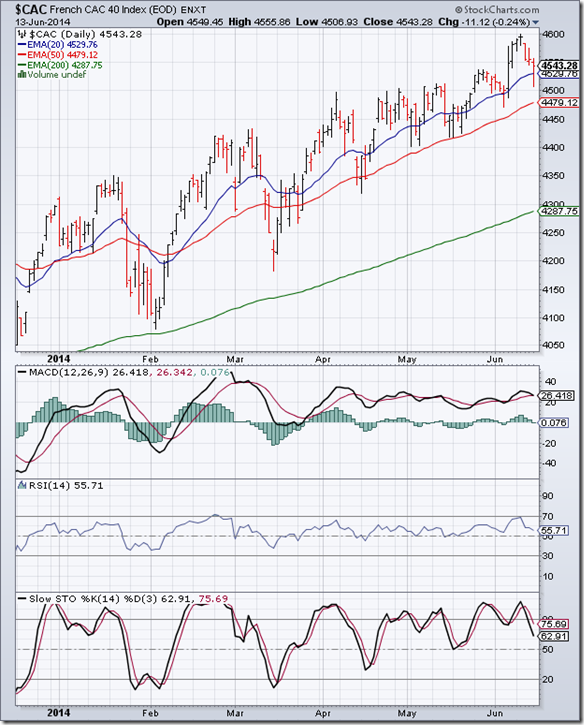
The 6 months daily bar chart pattern of CAC 40 rose to touch a new high just short of the 4600 level on Jun 10, but formed a ‘doji’ pattern (in candlestick parlance) that indicates indecision among bulls and bears.

The index corrected during the last three days of the week, dropping below its 20 day EMA intra-day on Jun 13, but recovering to close above all three EMAs. However, the index lost about 38 points (0.8%) on a weekly basis.

Can the index correct some more? It appears so. Technical indicators are in bullish zones, but showing downward momentum. MACD has moved down to touch its signal line in positive zone. RSI faced resistance from the edge of its overbought zone, and is falling towards its 50% level. Slow stochastic formed a ‘double-top’ reversal pattern inside its overbought zone, and has dropped sharply towards its 50% level.

The zone between 4420-4500 has several previous index tops, and should act as a support zone. The index is in a long-term bull market, so the dip can be used to add. But don’t forget to maintain a stop-loss.

DAX Index Chart (Germany)

DAX_Jun1314

The 6 months daily bar chart pattern of DAX touched a new high of 10034 on Jun 10, but could not sustain itself in the rarefied atmosphere above the 10000 level. Three days of correction took the index below its 20 day EMA on intra-day basis. However, the weekly close was above the 9900 level – about 74 points (0.7%) lower than the previous week.

Technical indicators are suggesting that the correction may not be over. MACD has crossed below its signal line in positive territory. RSI is falling towards its 50% level. Slow stochastic formed a ‘double-top’ reversal pattern inside its overbought zone, and has dropped sharply towards its 50% level. Both MACD and Slow stochastic are showing negative divergences by failing to touch new highs with the index.

The zone between 9600-9800 has several previous index tops, and should act as a support zone. The index is in a long-term bull market, which means dips provide adding opportunities.

RTS Index Chart (Russia)

RTSI_Jun1314

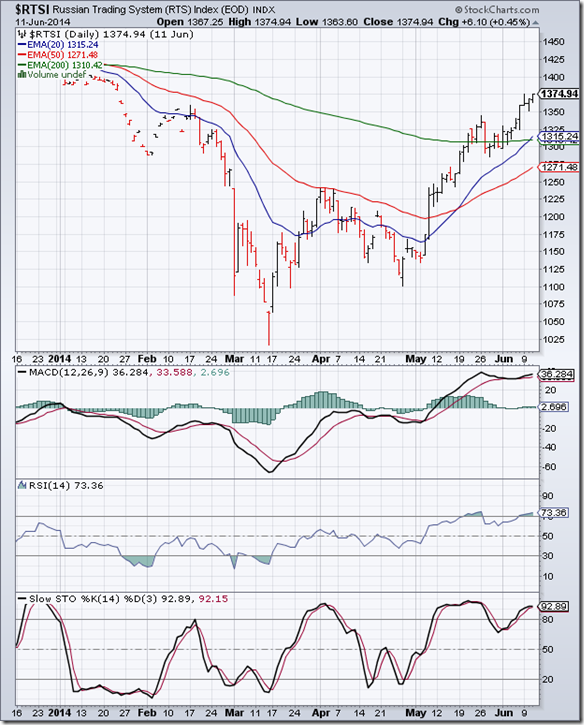
The 6 months daily bar chart pattern of RTSI formed a ‘double-bottom’ reversal pattern during March and April ‘14 that seems to have ended the bear market. The subsequent rally has taken the index above its three EMAs into bullish territory.

However, it may be too early for the bulls to start celebrations. The 50 day EMA is well below the 200 day EMA. Only a ‘golden cross’ of the 50 day EMA above the 200 day EMA will technically confirm a bull market.

There are other concerns as well. The index has touched a 4 months high, but all three technical indicators are looking overbought and showing negative divergences by failing to touch new highs with the index. A correction is likely.

Friday, June 13, 2014

Technical updates – Bharat Bijlee and Carborundum Universal

Modi-led NDA’s election victory seems to be bringing in good news. Consumer inflation (CPI) moderated a bit. More importantly, the IIP number showed an up-tick. Neither of these had anything to do with NDA’s victory, but occurred due to a gradual improvement in the economy.

The stock market is supposed to discount good (and bad) news in advance. Nowhere is this more evident than on the chart patterns of ‘infrastructure’ stocks. After prolonged slumber in bear markets, these stocks have not only woken up but are trying to make up for lost time in a hurry.

The stocks of Bharat Bijlee and Carborundum Universal are no exceptions. Both stocks touched their lows in Aug ‘13 and rose sharply to touch 2 year highs in 10 months. Have the fundamentals of both companies suddenly improved? Unlikely. These look like technical price spurts, which are unlikely to sustain. Be careful if and when you enter.

Bharat Bijlee

Bharat Bijlee_Jun1314

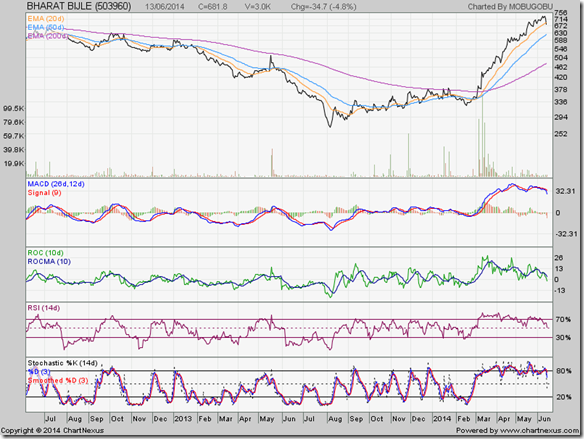
The stock of Bharat Bijlee touched a low of 274 in Aug ‘13, but made a ‘V’ shaped recovery followed by an accumulation period that lasted 7 months. The 200 day EMA provided strong resistance during Dec ‘13 and Jan ‘14. The stock price dropped below all three EMAs to touch a higher bottom of 326 in Feb ‘14. That was the signal that the bulls were waiting for.

A sharp price spurt above all three EMAs on strong volumes in Mar ‘14 propelled the stock into a bull market that was technically confirmed by the ‘golden cross’ of the 50 day EMA above the 200 day EMA.

The stock price rose to touch a 2 years high of 730 on Jun 9 ‘14 – gaining more than 150% from its Aug ‘13 low. Note that the bullish enthusiasm was not shared by the technical indicators, which showed negative divergences by touching lower tops. A price correction has set in. The stock price may drop to test support from the 600-620 zone.

Carborundum Universal

Carborundum_Jun1314 

The stock price of Carborundum Universal went through a gradual bottoming process, touching multiple lows around the 100 level during Aug ‘13. The sharp rise above all three EMAs on a volume surge took the stock to a high of 152 in Jan ‘14 – a quick 50% gain in 5 months.

Negative divergences in the technical indicators was followed by a correction that successfully tested support from its rising 200 day EMA. The subsequent rally ended with the stock price touching a 2 years high of 190 on Jun 9 ‘14.

Note that the stock price touched a higher top, but ROC and RSI touched lower tops while MACD and Slow stochastic formed ‘double-top’ reversal patterns that warned of a correction. There is a long-term support zone between 150-162, which the stock may test on the way down.

Wednesday, June 11, 2014

Nifty chart: a mid-week update (Jun 11 ‘14)

A weaker Rupee and return of economic growth in USA and Europe led to a 12.4% increase in exports in May ‘14 (over May ‘13). Gold imports fell a whopping 72%. But oil imports ensured that trade deficit increased to $11.23 Billion from $10.09 Billion in Apr ‘14.

The new NDA government has made all the right noises so far. That has kept market sentiment bullish if not euphoric. Retail investors are still exiting at every rise, and may end up missing the next leg of the rally.

The budget is just about a month away. The available time is too short to remove all the economic ills of the previous decade in one go. What will be interesting to watch is how the government prioritises its actions for course correction.

Nifty_Jun1114 

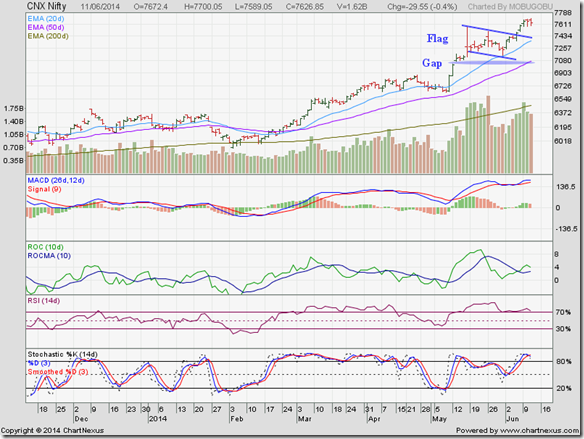
The upward ‘gap’ formed on May 13 ‘14, continues to remain unfilled, and may not get filled in a hurry. Why? Because immediately above the ‘gap’ is a consolidation pattern called a ‘flag’, from which the index has broken out upwards with good volume support.

Such upward break outs are often followed by pullbacks towards the break out point, i.e. the top of the ‘flag’. The pullback process has started already, and should receive twin support from the top of the ‘flag’ (at about 7400) and/or the rising 20 day EMA.

Daily technical indicators have started correcting overbought conditions. MACD and Slow stochastic are still inside their respective overbought zones, but have stopped rising. ROC and RSI are about to drop from their overbought zones.

A correction of 100-200 points will improve the technical ‘health’ of the chart, enabling Nifty to move up towards the psychological target of 8000.

FIIs were in profit-booking mode today, along with DIIs. Stay invested or use the dip to add.

Tuesday, June 10, 2014

WTI and Brent Crude Oil charts: undergo bull market corrections

WTI Crude chart

WTI Crude_Jun0914

The following comments were made in a technical update to the 6 months daily bar chart pattern of WTI Crude oil: “… volumes have dropped as oil’s price approached the 105 level, from where it has retreated twice before. Bears may try to defend the 105 level again.”

Looks like bears did a pretty good job of defending the 105 level once again. Oil’s price dropped below its 20 day EMA, but found good support from its rising 50 day EMA and bounced up sharply to close just below the 105 level with a decent uptick in volumes.

Can the bulls overcome bear resistance at 105 this time around? Technical indicators seem to be suggesting as much. MACD has crossed above its signal line in positive zone. RSI took support at its 50% level to move up sharply towards its overbought zone. Slow stochastic recovered from a brief dip below its 50% level and has returned to bullish territory.

On longer term weekly chart (not shown), all three EMAs are rising and oil’s price is trading above them in a long term bull market. The price band between 105-108 is a resistance zone. If bulls are able to cross that zone, oil’s price can rise to 110.

Brent Crude chart

BrentCrude_Jun0914

In a technical update to the 6 months daily bar chart pattern of Brent Crude oil posted two weeks back, investors were cautioned as follows: “It may be a bit early for bulls to celebrate. All three technical indicators are looking bullish, but showing negative divergences by failing to touch higher tops. A correction may follow.”

A sharp correction pushed oil’s price down below its three EMAs into bear territory, but not for long. Yesterday, oil’s price bounced up on good volumes above its 200 day and 50 day EMAs and closed exactly at its 20 day EMA.

Technical indicators are beginning to turn bullish. MACD is below its signal line in positive zone, but appears to have stopped falling. RSI spent a few days below its 50% level but has managed to move back into bullish zone. Slow stochastic has taken support from the edge of its oversold zone, and started moving up.

On longer term weekly chart (not shown), oil’s price is trading above its three weekly EMAs. Weekly technical indicators are in bullish zones.

Monday, June 9, 2014

Stock Index Chart Patterns: S&P 500 and FTSE 100 – Jun 06, ‘14

S&P 500 Index Chart

S&P 500_Jun0614

The 6 months daily bar chart pattern of S&P 500 consolidated a bit near its previous week’s high of 1924 before charging up towards the 1950 level – stopping just half a point short. Another week – another new high. To paraphrase an old song by Ace: How long will this be going on?

Technical indicators have been ‘flashing red’ for a while, with all three inside their overbought zones. Volumes have been moderate and sliding. The index is trading more than 40 points above its 20 day EMA. The vertical distance between the 50 day and 200 day EMAs is increasing.

All of the above point to an overbought market that is ripe for a correction. But a market can remain overbought for long periods. So, no need to sell in a hurry. But partial profit booking is always a good idea when a market is at a lifetime high.

It’s a bull market. Stay invested with a trailing stop-loss and enjoy the ride.

FTSE 100 Index Chart

FTSE_Jun0614

The 6 months daily bar chart pattern of FTSE 100 has been consolidating sideways within a ‘symmetrical triangle’ pattern after touching a high of 6895 on May 15. Triangles tend to be continuation patterns, so the eventual break out should be upwards.

However, triangles are unreliable. So, it is better to wait for the eventual break out before taking a buy/sell decision. All three EMAs are rising, and the index is trading above them in a bull market. Corrections and consolidations improve the technical ‘health’ of stock charts and provide them ‘energy’ to move higher.

Daily technical indicators are in downtrends, but not looking too bearish. MACD is sliding below its signal line in positive territory. RSI and Slow stochastic have moved up to their respective 50% levels after falling below them.

A break out can occur at any time. An upward break out should be accompanied by a volume spurt to validate the break out. Stay invested.

Bottomline? Daily bar chart patterns of S&P 500 and FTSE 100 are in long-term bull markets. S&P 500 reached another new lifetime high. FTSE 100 is consolidating within a triangle after touching a new lifetime high last month. Book partial profits, or stay invested with trailing stop-losses.

Sunday, June 8, 2014

BSE Sensex and NSE Nifty 50 index chart patterns – Jun 06, 2014

When it comes to stock market investing, otherwise rational human beings start showing quirky behaviour. When the stock indices seemed down and out in Aug ‘13, no one was interested in buying and market sentiment was full of doom and gloom.

Now that Sensex and Nifty have hit all-time highs, investors are worrying about a big crash and selling at every rise. ‘Recency bias’ you think? The last time the indices corrected in a major way was after the ‘diamond’ reversal pattern formed during Oct - Dec ‘10.

A stock index rising in a long-term bull market is like a very large ship cruising at full speed. It may make small changes in direction quickly but takes a much longer time to turn around. So, use dips to add. If you are selling at every rise, you may not be able to get back in – except at higher prices.

BSE Sensex index chart

Sensex_Jun0614

The upward ‘gap’ formed on the Sensex daily bar chart on May 13 continues to remain unfilled. Looks like it may not get filled anytime soon, and should act as a support to future down moves.

The index had entered a sideways consolidation within a symmetrical triangle pattern after touching a new high on May 16. A break out above the triangle with a ‘gap’ (on Fri. Jun 6) propelled the index to new all-time intra-day and closing highs.

Daily technical indicators are in bullish zones, but looking overbought. All four are showing negative divergences by failing to touch new highs with the index. A pullback towards the top of the triangle is likely. (A drop back inside the triangle will negate the triangle pattern.)

The vertical distance between the 50 day and 200 day EMAs is widening. That is also a sign of overbought conditions, which can lead to some correction or consolidation. So, stay invested but don’t be exuberantly bullish.

NSE Nifty 50 index chart

Nifty_Jun0614

The weekly bar chart pattern of Nifty ignored the previous week’s reversal bar pattern and rose to touch new intra-week and weekly closing highs. Reversal bars work best when they touch intermediate highs.

Weekly technical indicators have resumed their upward moves inside their respective overbought zones. However, barring MACD the other three – ROC, RSI, Slow stochastic – are showing negative divergences by failing to touch new highs with the index.

Volumes are still high, but have started to slide a bit. Some correction or consolidation can be expected, but the positive bias should remain till the budget in mid-July.

Bottomline? Chart patterns of BSE Sensex and NSE Nifty indices have closed at new lifetime highs and should continue to move higher. This is not a great time to enter, but you can always start a SIP in a good index or balanced fund.

Friday, June 6, 2014

An imaginary Q&A session about the current state of the Indian stock market

Q. The Sensex index has closed above the 25000 level for the first time ever. Are we in a new bull market – as some of the experts on business TV channels are claiming?

A. The short answer is, strangely, ‘No’. Why? Because it is a bull market all right, but not a ‘new’ bull market.

Q. Why not?

A. A ‘new’ bull market begins after a bear market ends – not when the Sensex touches a new high.

Q. So, when did the previous bear market end?

A. That depends on whether you are a short-term, medium-term or a long-term investor.

Q. Why should the end of a bear market change depending on one’s investment viewpoint?

A. That question can be best answered with an analogy. If you stand a couple of feet away from the trunk of a large tree in a garden, all you will see is wood. If you look at the same tree by standing 30 feet away from it, you will notice details like branches, leaves, flowers, bird’s nests.

Now, if you go to the roof of a high-rise building and try to look at the same tree, you may not be able to see it at all because there may be several hundred trees in the garden. So, viewpoint does make a difference.

Q. But how does this relate to the stock market?

A. Good question. Let us look at the Sensex chart of the past 16 years.

Sensex_max_Jun0614

The 200 day EMA (in green) is superimposed on the Sensex chart because in simplistic technical terms, an index (or stock) trading above the 200 day EMA is in a bull market, and trading below the 200 day EMA is in a bear market.

  • From Jan 2000 to May 2003, Sensex was in a bear market
  • From May 2003 to Jan 2008, Sensex was in a bull market
  • From Jan 2008 to Mar 2009, Sensex was in a bear market
  • From Mar 2009 to Nov 2010, Sensex was in a bull market
  • From Nov 2010 to Dec 2011, Sensex was in a bear market
  • From Dec 2011 onwards, Sensex has been in a bull market

Q. So far so good. But how is the viewpoint different?

A. Note the bear markets between Jan 2000 – May 2003 and Jan 2008 – Mar 2009. They look like strong bear periods with significant corrections (in percentage terms) from their respective tops. However, the bear market between Nov 2010 - Dec 2011 was much milder.

In fact, it looks like a ‘rounding bottom’ bullish consolidation pattern – which is clearly visible on the 200 day EMA. So, from a long-term perspective, the ‘new’ bull market actually started back in Mar 2009!

Q. Will the shorter-term viewpoints be different?

A. Let us see from the Sensex 5 yr. chart below.

Sensex_5yr_Jun0614

From this viewpoint, the period between Nov 2010 and Dec 2011 looks more like a bear market and less like a consolidation.

Now, the 1 yr Sensex chart.

Sensex_1yr_Jun0614

Here, it seems like the entire month of Aug ‘13 was spent in a bear market.

Q. So, what is the real point of these three charts?

A. From the long-term view point (16 yr chart), the ‘new’ bull market started in Mar 2009. From the medium-term view point (5 yr chart), the ‘new’ bull market started from Dec 2011. From the short-term view point (1 yr chart), the ‘new’ bull market started from Sep ‘13.

Regardless of what your view point may be, Sensex has been in a bull market for quite a while.

Q. Why are the TV experts calling the current market as a ‘new’ bull market?

A. If I wanted to be mean, I would say that they are absolutely clueless. But I don’t want to be mean. So, in their defence, all that can be said is that their extreme short-term perspectives can not distinguish the wood from the trees.

Q. Should small investors enter the market now, or should they wait for a correction?

A. That would be the same as ‘timing the market’, which most small investors should avoid. The smart thing to do is to make a financial plan and an asset allocation plan. Based on the plans, invest your savings systematically.

Related posts

Why Sensex should touch 25000 – a long-term view
Sensex touches 25000 – ready for a drum roll?
How to reallocate your assets

Wednesday, June 4, 2014

Nifty chart: a mid-week update (Jun 04 ‘14)

Nifty_Jun0414

As was widely expected, the RBI Governor left interest rates unchanged, but lowered SLR by 50 bps (from 23% to 22.5%). Will it help the market in any way? Well, yes, and no.

SLR is the amount to be compulsorily invested by banks in government securities. A reduction in SLR should mean the release of several thousand Crores of liquidity into the market – hence, greater availability of credit for would-be borrowers.

However, most banks invest much more than the SLR stipulated amount in government securities any way – perhaps because there are fewer borrowers in a slow economy. So, the reduction in SLR may not filter down to the market for several months.

The upward ‘gap’ of about 47 points, formed on May 13, still remains unfilled. Last Friday’s intra-day drop found support from the rising 20 day EMA and did not test support from the ‘gap’.

After the gyrations on May 16 (election results day), Nifty has settled into a sideways consolidation from which the likely break out should be upwards. Even if the index drops to fill or partly fill the ‘gap’, the up move should resume thereafter.

Daily technical indicators have corrected overbought conditions, and remain in bullish zones. MACD and RSI are still in their overbought zones. ROC has bounced up from the ‘0’ line. Slow stochastic has bounced up from its 50% level. Some more consolidation is possible.

FIIs have invested a net Rs 1000 Crores during the first three trading sessions in June. They are probably waiting for positive policy announcements to increase their buying.

It is a bull market. Remain long.

Tuesday, June 3, 2014

Gold and Silver charts: bottoms fall out

Gold Chart Pattern

Gold_Jun0214

The following comments were made in a technical update two weeks ago on gold’s daily bar chart pattern: “Bulls will try to defend the support zone between 1260-1280. But for how long?”

It took exactly six trading sessions for gold’s price to close below the 1260 level on strong volumes. So, the downward breach of the support zone between 1260-1280 is confirmed, right? Technically, not yet. Why? Because the 3% ‘whipsaw’ rule means only a close below 1222 will confirm the breach.

Looks like gold’s price is trying to find a bottom at 1240, from where it may attempt a pullback towards the 1260-1280 zone. If the zone now turns into a resistance zone, which it should, then the pulback may be short-lived. Gold’s price is likely to drop all the way down to test the Dec 31 ‘13 low of 1180.

All three daily technical indicators are in their respective oversold zones, which increases the probability of a pullback towards the 1260 level. That would be a good opportunity to short.

On longer term weekly chart (not shown), all three weekly EMAs are moving down and gold’s price is trading below them in a bear market.

Silver Chart Pattern

Silver_Jun0214

Two weeks back, the following observation was made about the daily bar chart pattern of silver: “All three indicators have formed bullish patterns of rising tops and rising bottoms, which may lead to another attempt at a rally past the falling 50 day EMA.”

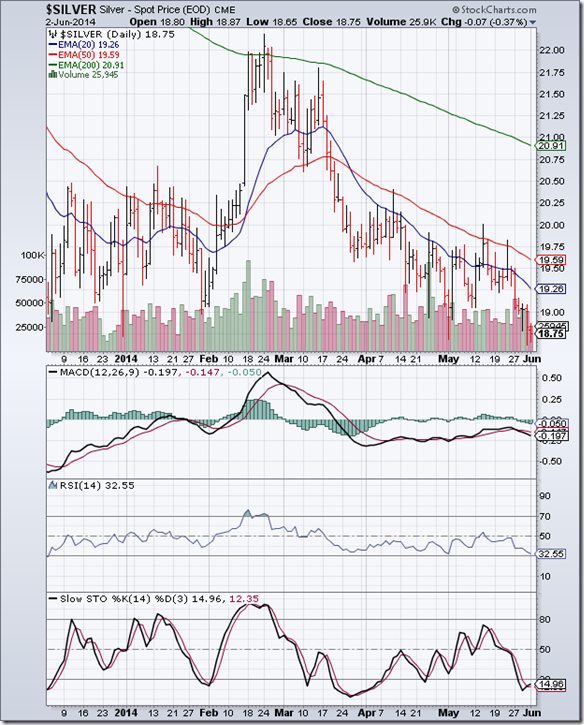
Silver’s price did climb above its falling 50 day EMA on intra-day basis (on May 22), but touched a lower top. It subsequently dropped on strong volumes and moved down below the 18.75 level – its previous low touched on Dec 31 ‘13. Silver’s price has closed exactly at 18.75, and may attempt to bounce up from here.

Technical indicators are looking bearish. MACD has crossed below its signal line in negative territory. RSI has dropped to the edge of its oversold zone. Slow stochastic is inside its oversold zone. Bears are likely to use every rise to sell.

On longer term weekly chart (not shown), all three weekly EMAs are sliding down and silver’s price is trading below them in a bear market.

Monday, June 2, 2014

Stock Index Chart Patterns: S&P 500 and FTSE 100 – May 30, ‘14

S&P 500 Index Chart

S&P 500_May3014

The 6 months daily bar chart pattern of S&P 500 soared past its previous (May 13) top of 1902 and closed above the 1920 level at a new lifetime high. Concerns of a possible ‘double top’ at 1900 were left by the wayside.

Volumes picked up a bit on Friday, but overall volumes during the week were subdued. All three EMAs are rising and the index is trading above them. However, the index is a good 30 points above its 20 day EMA. That makes it prone to a correction.

Daily technical indicators are bullish, but looking overbought. MACD has entered overbought territory. RSI is rising towards its overbought zone. Slow stochastic is well inside its overbought zone.

The index is in ‘blue-sky’ territory with no known resistances. In such situations, resistance often comes from round index levels. Note the resistance from the 1900 level in April and May.

So, where will the next likely resistance be? Possibly at 1950. Stay invested with a trailing stop-loss.

FTSE 100 Index Chart

FTSE_May3014

The 6 months daily bar chart pattern of FTSE 100 moved above the 6850 level but failed to test its May 15 top of 6895. It dropped to close below the 6850 level – but gained about 0.4% for the week.

Friday’s volumes were the highest in a month, which could be a sign of ‘distribution’. Selling near a previous top is quite common. All three EMAs are rising and the index is trading above them. There is no immediate threat to the long-term bull market.

Daily technical indicators are in bullish zones, but looking weak. MACD is sliding below its signal line in positive territory. RSI and Slow stochastic is falling towards their respective 50% levels.

Stay invested but maintain a stop-loss to protect profits.

Bottomline? Daily bar chart patterns of S&P 500 and FTSE 100 are in long-term bull markets. S&P 500 rose to touch a new lifetime high. FTSE 100 is consolidating after touching a new lifetime high. Book part profits or stay invested with suitable stop-losses.

Sunday, June 1, 2014

BSE Sensex and NSE Nifty 50 index chart patterns – May 30, 2014

The stock market was in a corrective mode through the week, with both Sensex and Nifty losing ground. The GDP number for 2013-14 was marginally higher than the previous year at 4.7%, but marked the second straight year below the 5% mark. The economy appears to have bottomed out.

Despite some recent profit booking, FIIs were net buyers of almost Rs 15000 Crores in equities for the month of May ‘14. DIIs were net sellers of Rs 4600 Crores. After the sharp price spurt from May 9 to May 16, both indices entered a sideways consolidation that has corrected overbought conditions.

Corrections and consolidations are essential ingredients of index movements. Such pauses in bull markets improve the technical ‘health’ of chart patterns and provide ‘energy’ for the next up move. You can either wait out these corrective moves, or use them to add to existing portfolios.

BSE Sensex index chart

SENSEX_May3014

The upward ‘gap’ on Sensex chart formed on May 13 has remained unfilled till date. It is expected to support the index from falling much further. Remember that part or complete filling of the ‘gap’ has bullish implications - the index is supposed to resume its up move thereafter.

Daily technical indicators are correcting overbought conditions. MACD has crossed below its signal line and looks ready to drop from its overbought zone. ROC has dropped sharply below its 10 day MA and is about to enter negative territory. RSI has slipped from its overbought zone. Slow stochastic has dropped to its 50% level.

Some more correction or consolidation is possible. Sensex may test support from the ‘gap’.

NSE Nifty 50 index chart

Nifty_May3014

Nifty’s weekly bar has formed a ‘reversal week’ pattern (higher high, lower close) on strong volumes. The corrective move may continue next week – but a big correction is not expected.

Weekly technical indicators have started correcting overbought conditions, but remain in bullish zones. MACD is well inside its overbought zone, but its upward momentum is slowing down. ROC has dropped towards its 10 week MA inside overbought zone. RSI has formed a small ‘rounding top’ reversal pattern inside overbought territory. Slow stochastic has dropped to the edge of its overbought zone.

Hold existing positions, or use the dip to add.

Bottomline? Chart patterns of BSE Sensex and NSE Nifty indices have been correcting after closing at new lifetime highs in the previous week. Expect the indices to resume their up moves soon. If you want to enter now, start a SIP in a good index or balanced fund instead of trying your luck with individual stocks.