Wednesday, September 30, 2015

Nifty chart: a mid-week update (Sep 30 ‘15)

The 50 bps (0.5%) interest rate cut by the RBI Governor came as a positive surprise for the market. The consensus estimate was a 25 bps cut – and as often happens, the consensus estimate was wrong!

SBI immediately announced transmission of 40 bps of the cut to its base rate for borrowers. Other banks have followed with cuts of 30-35 bps to their base rates. The stock market has celebrated the good tidings with a rally.

FIIs remain sceptical. As per provisional figures, their net selling in equities during Sep ‘15 has exceeded Rs 11000 Crores. DIIs were net buyers of equity worth more than Rs 10000 Crores. Interestingly, DIIs were net sellers today for the first time this month, as FIIs turned marginal net buyers.

Nifty_Sep3015

The daily bar chart pattern of Nifty has been trading below the big 165 points ‘gap’ that formed below all three EMAs in bear territory on Aug 24 ‘15. Such ‘gaps’ act as resistance zones during future up moves.

However, the entire trading below the ‘gap’ appear to be forming an ‘inverse head and shoulders’ reversal pattern with the ‘neckline’ at the lower edge of the ‘gap’.

The left shoulder (marked LS) and Head of the pattern have been completed. The right shoulder (marked RS?) is still in the process of formation. If the pattern does play out, the index should fill the ‘gap’ and move above its three EMAs into bull territory.

But will the down trend from the lifetime high touched in Mar ‘15 (marked by blue down trend line) be reversed convincingly? There are two arguments against it and one argument for it.

First, ‘gaps’ formed in bear territory often get filled, but the down trend usually resumes subsequently. Second, FIIs need to turn buyers in a big way. For that to happen, Q2 (Sep ‘15) results need to be a lot better than Q1 results. The odds are low.

However, the ‘inverse head and shoulders’ pattern has measuring implications. The depth of the ‘head’ below the ‘neckline’ should be added to the ‘neckline’ to arrive at an upward target of about 8580. That should carry the index above the down trend line.

Daily technical indicators are beginning to look bullish. MACD is rising above its signal line in negative zone. Note that the signal line has formed a bullish ‘rounding bottom’ pattern. ROC has started rising below its 10 day MA in positive zone. RSI is climbing towards its overbought zone. Slow stochastic reversed direction after facing resistance from the edge of its overbought zone but is trying to move up again.

It will require strong buying support for the index to fill the ‘gap’ and move higher. That may not happen right away.

Monday, September 28, 2015

Will the likely interest rate cut by RBI be a non-event? – a guest post

Will he, or won’t he? That seems to be the question. Experts of different hues are expecting a 25 bps (0.25%) interest rate cut by the RBI Governor. That means, there will be no positive surprise for the stock market if the rate cut does come through.

There is also a possibility that the RBI Governor maintains status quo. That will be a negative surprise for the market and initiate a sell-off.

What if the rate cut is 50 bps or higher? The probability of that – based on Dr Rajan’s track record so far – is low. But it will be a definite positive surprise for the stock market.

In this month’s guest post, Nishit explains why the three tranches of interest rate cuts by Dr Rajan has failed to stimulate the Indian economy, and why he doesn’t expect the RBI Governor to be dovish in his announcement.

--------------------------------------------------------------------------------------------------------------------------------------------

Over the past few weeks, the impression given in the media is that an interest rate cut by RBI will stimulate the Indian economy. This is a wrong picture being portrayed. Tweaking interest rates is just one of the tools for stimulating the economy. More important are tax reforms and simplifying ease of doing business in India.

Implementation of GST will be the single biggest factor for growth of the Indian economy. Now, let us look at the interest rate cuts. Since, January the RBI has cut rates by 75 basis points (0.75%) in three tranches. The Banks have passed on barely 30 basis points (0.3%) to the end customer, citing high cost of deposits. The only exception has been HDFC Bank which has passed on 0.5-0.6% rate cut to the consumer.

What interest rate cuts do is lower the cost of deposits for Banks (has anyone noticed how quickly Banks are lowering fixed deposit rates?), but banks are not passing on the benefit of lower rates to people who borrow from Banks. This will only lead to Banks making more profits.

Also, if the RBI Governor cuts rates at a faster pace and tomorrow inflation rises how does he deal with it? In US the rates are near to 0 and they can stimulate the economy by ‘Quantitative Easing’, i.e. injecting huge sums of money into the economy by printing Bank notes. Is India in a similar position to do so?

Instead, by cutting rates slowly and allowing Banks to first transmit the rate cuts to its borrowers there are two advantages. The Governor gets more time to evaluate the inflation scenario and rate cuts get fully passed on to borrowers.

Hence the drama dutifully played up by television anchors is actually harmful in the long term. Simply cutting rates is  not the solution to all the problems in the economy. If it was that simple the World economy would not be where it is now and the US would not look at raising interest rates.

On Tuesday (Sep 29 ’15) I expect a maximum 25 basis points (0.25%) cut and I would not be surprised if there is no rate cut also.

--------------------------------------------------------------------------------------------------------------------------------------------

(Nishit Vadhavkar is a Quality Manager working at an IT MNC. Deciphering economics, equity markets and piercing the jargon to make it understandable to all is his passion. "We work hard for our money, our money should work even harder for us" is his motto.

Nishit blogs at Money Manthan. You can reach him at nish.stockid@gmail.com)

Sunday, September 27, 2015

Stock Index Chart Patterns: S&P 500 and FTSE 100 – Sep 25, 2015

S&P 500 Index Chart

SPX_Sep2515

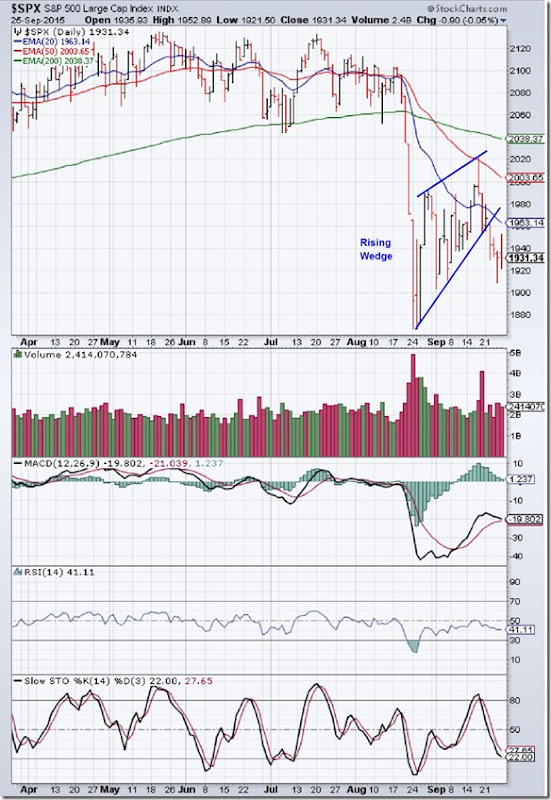
The following comment appeared in last week’s post on the daily bar chart pattern of S&P 500: “The index has formed a bearish ‘rising wedge’ pattern, from which the likely break out is downwards.”

The index made a futile bid to rally within the ‘rising wedge’ pattern on Mon. Sep 21 ‘15 and touched the 1980 level intra-day, but resistance from the falling 20 day EMA put paid to any bullish hopes.

The index dropped sharply below the wedge on Tue. Sep 22, and traded below the wedge for the rest of the week – touching an intra-day low of 1909 on Thu. Sep 24 before recovering to close more than 1.3% lower at 1931.

Daily technical indicators have turned bearish. MACD is falling towards its signal line after failing to emerge from its oversold zone. RSI is gradually sliding down below its 50% level. Slow stochastic has dropped to the edge of its oversold zone.

The index is trading below its three falling EMAs in bear territory.

On longer term weekly chart (not shown), the index closed below its falling 20 week and 50 week EMAs but is trading above its rising 200 week EMA in a long-term bull market. MACD is falling deeper inside its oversold zone. RSI and Slow stochastic are in bearish zones, and showing downward momentum. The index may fall lower to test the support zone between 1750-1800.

FTSE 100 Index Chart

FTSE_Sep2515

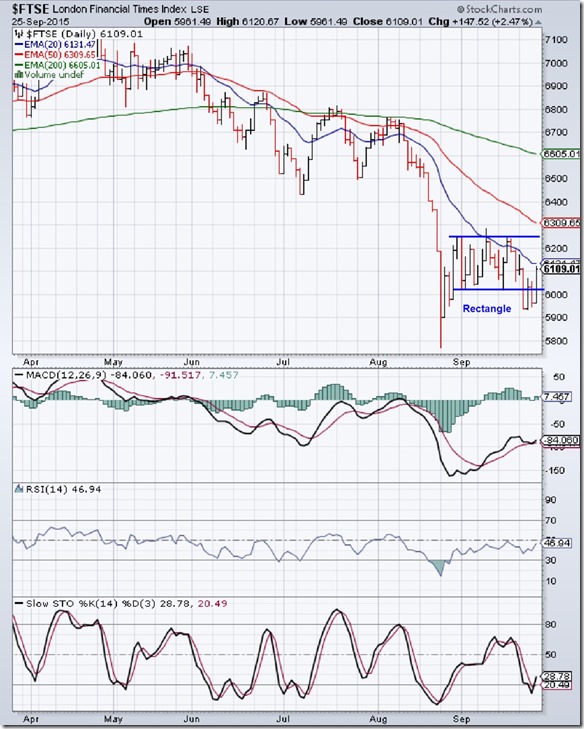
The daily bar chart pattern of FTSE 100 broke down below the ‘rectangle’ pattern – within which it was trading for three weeks – on Tue. Sep 22. The strong volumes (not shown) indicated that bear dominance was likely to increase.

But the unreliability of ‘rectangle’ patterns was evident as the index managed to recover and climb back inside the ‘rectangle’ by the end of the week and actually closed a few points higher on a weekly closing basis.

Daily technical indicators are in bearish zones, but showing some upward momentum. However, there isn’t much hope for bulls just yet. The index continues to trade below its three EMAs in a bear market.

On longer term weekly chart (not shown), the index closed well below its three weekly EMAs for the sixth week in a row, and may have entered a long-term bear market. Weekly technical indicators are in bearish zones, but their downward momentum is slowing down.

Saturday, September 26, 2015

BSE Sensex and NSE Nifty 50 index chart patterns – Sep 24, 2015

Clarifications by the Finance Ministry about non-applicability of MAT for Foreign Portfolio Investors (FPIs) and Foreign companies with no permanent establishment in India failed to have much effect on the negative sentiment in the Indian market.

FIIs stepped up their selling. As per provisional figures, their net selling in equities exceeded Rs 2300 Crores in a holiday-shortened week. DII were net buyers of equity worth about Rs 1400 Crores. That could not prevent both Sensex and Nifty from losing more than 1.3% on weekly closing basis.

Prime Minister Narendra Modi met 42 CEOs of Fortune 500 companies – including CEOs of 8 of the top 10 financial institutions – during his recent visit to New York. He is also expected to meet CEOs of top tech companies in the Silicon Valley in an attempt to improve increasing FDI inflows for development of India’s infrastructure.

A late surge in monsoon rains has brought down the total rain shortfall across India to –13% – though the shortfall in some parts of the country is much higher. That should help the standing kharif crop and provide adequate moisture for sowing of the rabi crop.

BSE Sensex index chart

SENSEX_Sep2415 

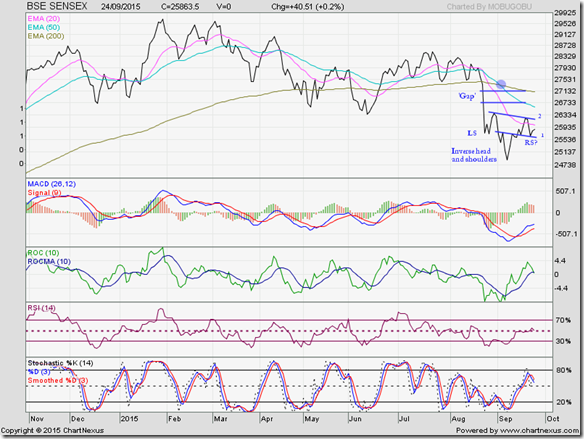
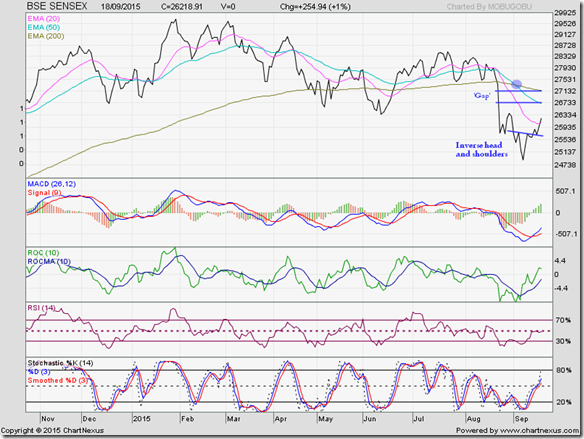
The daily closing chart pattern of Sensex has been trading below its three EMAs in bear territory since the large ‘gap’ formed on the bar chart pattern on Aug 24 ‘15. The ‘death cross’ (marked by light blue circle) of the 50 day EMA below the 200 day EMA has technically confirmed a bear market.

Sensex appears to be forming a complicated ‘inverse head and shoulders’ reversal pattern, which can finally end the 8 months long down trend that started after the index closed at 29682 on Jan 29 ‘15. The pattern has not completed yet, so caution is suggested.

The left shoulder (marked LS) was itself a small ‘double bottom’ reversal pattern – formed during Aug 24-26. The index then dropped to form the ‘head’ during Sep 1-14 – which was itself a small ‘inverse head and shoulders’ pattern with a downward-sloping neckline (marked ‘1’). This neckline (‘1’) has since acted as a support for the index.

The index rose to touch downward-sloping neckline (marked ‘2’) of the larger and more complicated ‘inverse head and shoulders’ pattern, only to drop down to neckline (‘1’) before bouncing up to form the possible right shoulder (marked ‘RS?’).

If the pattern plays out as expected – and it would require revival of FII buying to do so – the index should rally above neckline (‘2’) and close the ‘gap’. What can be the trigger for FII buying? A widely expected interest rate cut by RBI on Sep 29.

Will the RBI oblige? Low WPI and CPI inflation may just force the RBI Governor’s hand. A 25 bps rate cut has already been discounted by the current index level. A 50 bps cut should encourage FIIs to start buying again.

Daily technical indicators are giving mixed signals. MACD is rising above its signal line in negative zone. ROC is about to cross below its rising 10 day MA and fall back into negative zone. RSI is seeking support from its 50% level after briefly rising above it. Slow stochastic is falling towards its 50% level.

Wait for the RBI Governor’s decision before deciding to buy or sell.

NSE Nifty 50 index chart

Nifty_Sep2415

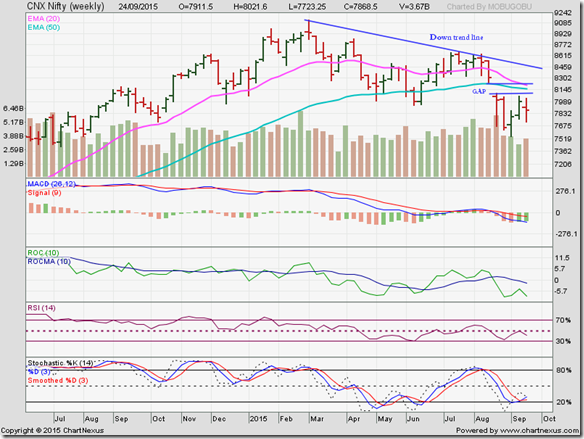
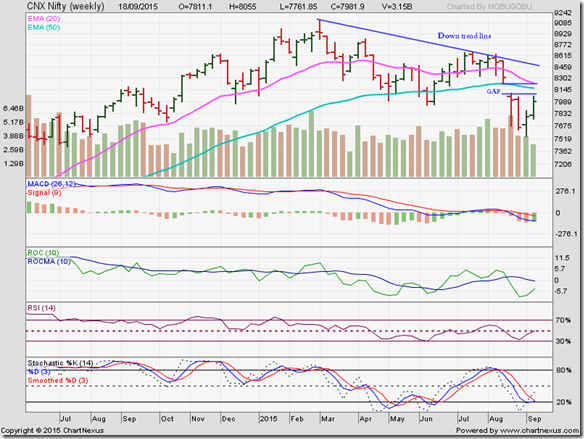
The weekly bar chart pattern of Nifty has spent 5 straight weeks below the weekly ‘gap’ formed on the chart in the week ending on Aug 28 ‘15. The 20 week and 50 week EMA are falling and the index is trading below them in bear territory.

However, the index closed more than 900 points above its rising 200 week EMA (not shown). That means the long-term bull market is intact, though bears are ruling the chart in the near term.

Weekly technical indicators are in bearish zones and showing downward momentum. MACD is falling below its signal line in negative territory. ROC has dropped back inside its oversold zone, and remains below its sliding 10 week MA. RSI has started to move down after facing resistance from its 50% level. Slow stochastic has bounced up weakly from the edge of its oversold zone.

Bottomline? The chart patterns of Sensex and Nifty remain in down trends and are trading below bearish ‘gaps’. Daily bar charts may be forming trend reversal patterns. Long-term bull markets are still intact. Hold on to existing portfolios and await RBI Governor’s pronouncements on Sep 29.

Wednesday, September 23, 2015

Nifty chart: a mid-week update (Sep 23 ‘15)

FIIs remain wary of the economic slowdown in China and a possible interest rate hike in the USA, and is pulling out from emerging markets in a big way. India has also been affected by the global sell-off, though its economy is in much better shape than most emerging markets.

As per provisional figures, FIIs have been net sellers of equity worth Rs 2200 Crores during this week, while DIIs have been net buyers of equity worth Rs 1400 Crores. Interestingly, FIIs were net buyers on Mon. Sep 21 – so most of their selling occurred in the past 2 days.

Good rainfall in states like Maharashtra, Goa, Madhya Pradesh, Chattisgarh has filled reservoirs and brought down the overall monsoon deficiency to 13% – well within the ‘normal’ range of –19% to +19%. However, the deficiency in South and North East India and parts of UP is higher.

Nifty_Sep2315

Bears (read: FIIs) continue their stranglehold of the daily closing chart pattern of Nifty. After briefly crossing above its 20 day EMA, the index has dropped below it, and has closed below its three EMAs in bear territory.

It is not all gloom and doom for bulls. The index may be forming a complicated ‘inverse head and shoulders’ reversal pattern with a downward-sloping neckline below the large ‘gap’ that appeared on the daily bar chart a month ago.

The ‘left shoulder’ (marked LS) of the likely ‘inverse head and shoulders’ pattern was itself a small ‘double bottom’ reversal pattern. The index rose to the downward-sloping neckline, but dropped lower to form the ‘head’, which was itself a small ‘inverse head and shoulders’ reversal pattern.

The index rose again to the downward-sloping neckline, then dropped to test support from the neckline of the ‘head’ and then bounced up slightly today. If the index can rally some more, the ‘right shoulder’ (marked RS?) of the complicated ‘inverse head and shoulders’ pattern will complete its formation – leading to an upward break out above the downward-sloping neckline, and a possible filling of the ‘gap’.

It may be a big IF, because of the F&O expiry tomorrow. If FIIs continue to sell, the complicated ‘inverse head and shoulders’ pattern will get negated and Nifty may fall below the ‘head’ (7559).

Daily technical indicators are showing bullish signs. MACD has emerged from its oversold zone and is rising above its signal line. Note that the signal line has formed a bullish ‘rounding bottom’ pattern. ROC faced resistance from the edge of its overbought zone, and is falling towards its rising 10 day MA. RSI has managed to move above its 50% level. Slow stochastic has reversed direction after facing resistance from the edge of its overbought zone.

On longer term weekly chart (not shown), Nifty is trading sideways below the weekly ‘gap’ formed in the week ending on Aug 28 ‘15, and its 20 week and 50 week EMAs but closed above its rising 200 week EMA. The long-term bull market is intact. Weekly technical indicators are in bearish zones. Nifty will take some more time to reverse the down trend that began in Mar ‘15.

Tuesday, September 22, 2015

WTI and Brent Crude Oil charts: an update

WTI Crude chart

WTIC_Sep2115

The daily bar chart pattern of WTI Crude oil has been consolidating sideways within a ‘symmetrical triangle’ pattern for the past couple of weeks. Oil’s price has managed to close slightly above its 50 day EMA, but continues to trade well below its falling 200 day EMA in a bear market.

‘Symmetrical triangle’ pattern tends to be unreliable. The eventual break out can be upwards, downwards or sideways through the apex of the triangle. So, it is better to wait for the break out before initiating any buy/sell action.

Daily technical indicators are in bullish zones but giving mixed signals – which is typical during sideways consolidations. MACD has managed to move up into positive territory above its rising signal line, but its upward momentum is waning. RSI is zigzagging sideways along its 50% level. Slow stochastic is sliding down towards its 50% level.

On longer term weekly chart (not shown), oil’s price faced resistance from its falling 20 week EMA and is trading below its three weekly EMAs in a long-term bear market. Weekly technical indicators have corrected oversold conditions but remain in bearish zones.

Brent Crude chart

BRENT_Sep2115

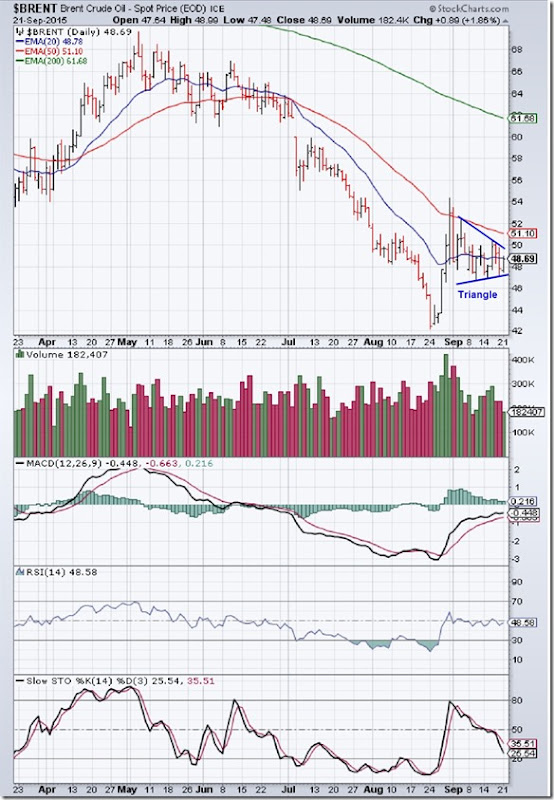
The daily bar chart pattern of Brent Crude oil has been consolidating sideways within a triangle pattern with a downward bias. Oil’s price has closed below its three EMAs in a bear market.

Of late, up day volumes have been higher than down day volumes – which is probably more due to short covering than any actual buying interest.

All three daily technical indicators are in bearish zones. MACD is moving sideways above its signal line in negative territory. RSI is also moving sideways just below its 50% level. Slow stochastic is falling sharply towards its oversold zone.

A downward break out from the triangle appears likely. Since triangle patterns are unreliable, it may be prudent to wait for the break out before going short or long.

On longer term weekly chart (not shown), oil’s price is trading well below its three weekly EMAs in a long-term bear market. Weekly technical indicators corrected oversold conditions and are moving sideways in bearish zones. Lower price levels are likely.

Sunday, September 20, 2015

Stock Index Chart Patterns: S&P 500 and FTSE 100 – Sep 18, 2015

S&P 500 Index Chart

S&P500_Sep1815

The daily bar chart pattern of S&P 500 climbed above the 2000 level and the falling 50 day EMA on intra-day basis on Thu. Sep 17, but formed a ‘reversal day’ pattern (higher high, lower close). That was just the signal bears were waiting for.

The index dropped on huge volumes to close below all three EMAs in bear territory by the end of the week. The index has formed a bearish ‘rising wedge’ pattern, from which the likely break out is downwards.

Daily technical indicators are turning bearish. MACD was in the process of correcting oversold condition, but its upward momentum has stalled. RSI faced strong resistance from its 50% level and has started to move down. Slow stochastic has dropped from its overbought zone.

On longer term weekly chart (not shown), the index formed a ‘reversal bar’ (higher high, slightly lower close) and closed below its falling 20 week and 50 week EMAs but is trading above its rising 200 week EMA in a long-term bull market. Weekly technical indicators are in bearish zones, and showing downward momentum. The index can drop to the support zone between 1750-1800.

FTSE 100 Index Chart

FTSE_Sep1815

The daily bar chart pattern of FTSE 100 continued to consolidate sideways within a ‘rectangle’ pattern. The index briefly ventured above its falling 20 day EMA before dropping on strong volumes (not shown) to close below all its three EMAs in bear territory.

‘Rectangle’ patterns tend to be unreliable. That means a break out can occur either above or below the pattern. As the index has been trading in a bear market for more than 2 months, the expected break out is downwards.

Daily technical indicators are turning bearish. MACD failed to emerge from its oversold zone and its upward momentum has stalled. RSI faced resistance from its 50% level and has started to fall. Slow stochastic is above its 50% level but zigzagging sideways.

On longer term weekly chart (not shown), the index closed well below its three weekly EMAs for the fifth week in a row, and may have entered a long-term bear market. Weekly technical indicators are in bearish zones, with MACD sliding deeper inside its oversold zone.

Saturday, September 19, 2015

BSE Sensex and NSE Nifty 50 index chart patterns – Sep 18, 2015

The US Fed’s decision to maintain status quo on interest rates on Thu. Sep 17 – due to slow growth in China and Europe and recession in Canada - came as a big relief to India’s stock market participants.

FIIs turned net buyers of equity on Fri. Sep 18, though they were net sellers of equity worth Rs 550 Crores during the week, as per provisional figures. DII net buying of equity exceeded Rs 1500 Crores.

During a holiday-shortened trading week, both Sensex and Nifty gained more than 2% each on a weekly closing basis. However, both indices are near strong resistance levels. Further gains will depend on continued FII buying.

BSE Sensex index chart

SENSEX_Sep1815

The daily closing chart pattern of Sensex had corrected sharply after forming a downward ‘gap’ on Aug 24 ‘15. It subsequently formed a small ‘inverse head and shoulders’ reversal pattern with a downward-sloping neckline. The index broke out above the neckline last week, followed by a pullback to the neckline and then rose to cross above its falling 20 day EMA.

Volumes (not shown) during the upward break out above the neckline wasn’t significantly higher – which is a requirement for technical validity of the break out. ‘Inverse head and shoulders’ pattern has target implications. The fall below the neckline (of 860 points) should be added to the neckline level to arrive at an upward target of about 26580.

That will still leave the index below the ‘gap’ and its falling 50 day and 200 day EMAs. The ‘death cross’ (marked by light blue circle) of the 50 day EMA below the 200 day EMA technically confirmed a bear market.

Only a convincing up move (i.e. one accompanied by rising volumes) above the ‘gap’ will reverse the bear market. That may not happen in a hurry – unless FIIs turn buyers.

Daily technical indicators are turning bullish. MACD has crossed above its signal line and emerged from its oversold zone. ROC has entered positive zone above its rising 10 day MA. Slow stochastic has climbed above its 50% level. RSI is moving sideways after facing resistance from its 50% level.

Sensex formed a ‘shooting star’ pattern (in candlestick parlance) on Fri. Sep 18, which can end the rally from the intra-day low of 24833 touched on Sep 8.

NSE Nifty 50 index chart

Nifty_Sep1815

The weekly bar chart pattern of Nifty failed to overcome resistance from the downward ‘gap’ formed in the week ending on Aug 28 ‘15, despite combined buying by FIIs and DIIs on the last day of the week.

The index continues to trade below its falling 20 week and 50 week EMAs and the blue down trend line connecting the Mar ‘15 and Jul ‘15 tops. However, it closed well above its rising 200 week EMA (not shown) in a long-term bull market.

Nifty will need to close the ‘gap’ and then move convincingly above the down trend line for bulls to regain control of the chart. The ongoing price wise and time wise correction is improving the technical ‘health’ of the chart.

Weekly technical indicators are in bearish zones but showing some signs of turning around. MACD is falling below its signal line in negative territory, but its downward momentum has slowed down. ROC has emerged from its oversold zone, but remains below its sliding 10 week MA in negative territory. RSI has moved up to its 50% level after receiving good support from the edge of its oversold zone. Slow stochastic is seeking support from the edge of its oversold zone.

Bottomline? The bar chart patterns of Sensex and Nifty are in down trends and trading below bearish ‘gaps’. However, there are some signs of trend reversal. Long-term bull markets are still intact. Hold on to existing portfolios or add very selectively. Maintain stop-losses – whether you decide to add or hold.

Wednesday, September 16, 2015

Nifty chart: a mid-week update (Sep 16 ‘15)

Inflation seems to be well under control. WPI fell for the 10th straight month to –4.95% in Aug ‘15, compared to –4.05% in Jul ‘15 and 3.85% in Aug ‘14. CPI dropped slightly to 3.66% compared to a downwardly adjusted 3.69% in Jul ‘15 and 7.03% in Aug ‘14. An interest rate cut at the end of the month seems likely.

It wasn’t all good news. India’s exports contracted for the 9th month in a row – falling 20.66% in Aug ‘15. Dip in global demand was the main culprit. Imports declined by almost 10%. Trade deficit was lower at $12.47 Billion compared with $12.81 Billion in Jul ‘15.

FIIs are still in bearish mode. Their net selling in equities nearly touched Rs 1200 Crores during the three days of trading this week. DIIs remained bullish. Their net buying in equities was almost Rs 1100 Crores.

NIFTY_Sep1615

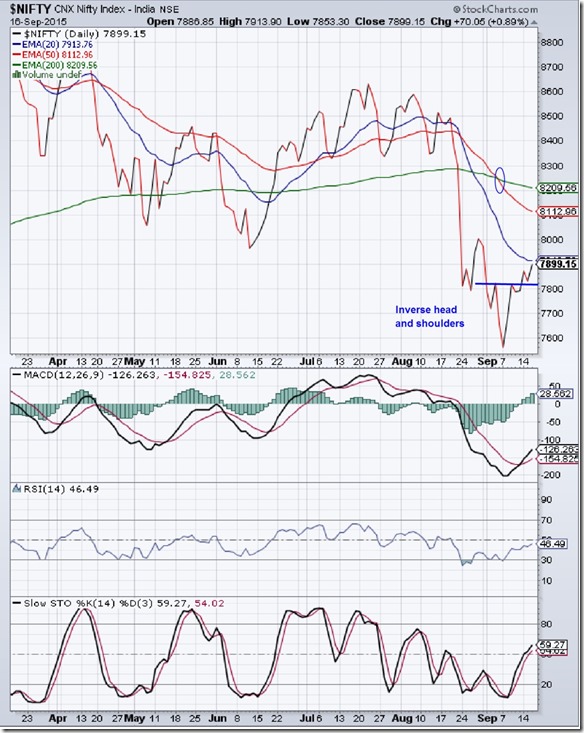
Bears (i.e. FIIs) are in control of the daily closing chart pattern of Nifty. All three EMAs are falling. The index is trading below them. The ‘death cross’ of the 50 day EMA below the 200 day EMA (marked by blue oval) technically confirmed a bear market.

There are some signs of trend change. Nifty formed a small inverse head-and-shoulders reversal pattern after a sharp correction with a downward ‘gap’ (refer chart in previous update) followed by an upward break out above, and a pullback towards, the neckline.

The upward break out above the neckline was not accompanied by a volume surge. That puts a question mark on the technical validity of the break out.

Today, the index faced the first line of resistance from its falling 20 day EMA. Stronger resistance is likely from the falling 50 day and 200 day EMAs and the 165 points downward ‘gap’ (not shown) that formed on Aug 24 ‘15. Bulls have their work cut out.

Daily technical indicators are showing some upward momentum. MACD has crossed above its signal line but is yet to emerge from its oversold zone. The signal line has formed a bullish ‘rounding bottom’ pattern. RSI is gradually moving up towards its 50% level after bouncing up from the edge of its oversold zone. Slow stochastic has entered bullish zone by climbing above its 50% level.

On longer term weekly chart (not shown), Nifty is trading below its 20 week and 50 week EMAs but above its rising 200 week EMA. The long-term bull market is intact. The correction will improve the technical ‘health’ of the chart, enabling the index to touch new highs. But that will take some time.

Tuesday, September 15, 2015

Gold and Silver charts: an update

Gold chart pattern

Gold_Sep1415

The following comments appeared in the previous post on the daily bar chart pattern of gold: “Volumes have trailed off, indicating lack of sufficient buying interest. Expect lower levels soon.” 

Gold’s price rose past its 20 day and 50 day EMAs but touched a lower intra-day high of 1148 on Tue. Sep 1. The down move resumed with increasing volumes. Gold’s price dropped to the 1100 level, where it is trying to find a temporary bottom.

Daily technical indicators are in bearish zones. All three EMAs are falling again and gold’s price is trading below them in a bear market. Lower levels are likely.

On longer term weekly chart (not shown), gold’s price closed below all three weekly EMAs in a long-term bear market. Weekly technical indicators are in bearish zones and showing downward momentum.

Silver chart pattern

Silver_Sep1415

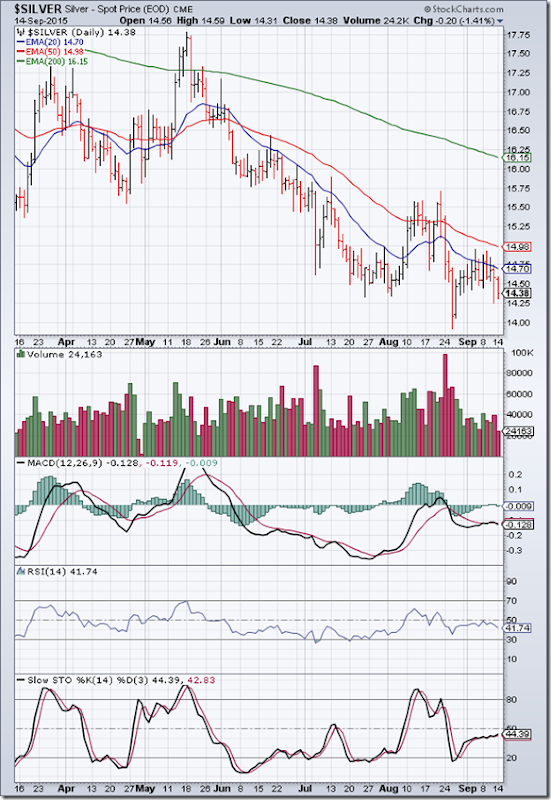
The daily bar chart pattern of silver rose above its falling 20 day EMA on five straight trading sessions, but could not cross above the 15 level or its falling 50 day EMA.

Bullish enthusiasm faded soon. Silver’s price has dropped below all three EMAs in bear territory.

Daily technical indicators are in bearish zones. MACD has crossed below its signal line. RSI faced resistance from its 50% level and has started falling. Slow stochastic is moving sideways with a slight upward bias.

The Aug ‘15 low of 13.90 may get tested and breached.

On longer term weekly chart (not shown), silver’s price is trading below its three weekly EMAs in a long-term bear market. Technical indicators are in bearish zones and sliding down.

Monday, September 14, 2015

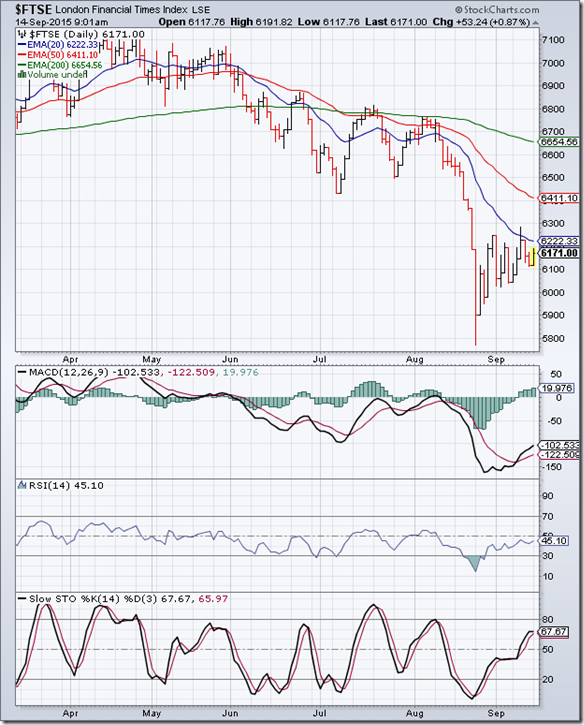
Stock Index Chart Patterns: S&P 500 and FTSE 100 – Sep 11, 2015

S&P 500 Index Chart

S&P500_Sep1115

The daily bar chart pattern of S&P 500 consolidated sideways during a holiday-shortened week, and closed with a weekly gain of 2%. The index traded below its three EMAs in bear territory for the third straight week, with the falling 20 day EMA providing overhead resistance.

The index maybe forming a ‘symmetrical triangle’ pattern, from which the eventual break out should be downwards. But triangles are unreliable patterns – so it may be prudent to wait for the break out before initiating any buy/sell action.

Daily technical indicators are showing some upward momentum. MACD has crossed above its signal line inside its oversold zone. RSI is moving up towards its 50% level. Slow stochastic has managed to creep up above its 50% level into bullish zone.

Volumes on the lone down-day during the week (Wed. Sep 9) was the highest – indicating strong bear presence.

On longer term weekly chart (not shown), the index closed below its falling 20 week and 50 week EMAs but is trading above its rising 200 week EMA in a long-term bull market. Weekly technical indicators are in bearish zones, but RSI and Slow stochastic bounced up a bit from the edges of their respective oversold zones. The index may drop to the support zone between 1750-1800.

FTSE 100 Index Chart

FTSE_Sep1115

The daily bar chart pattern of FTSE 100 consolidated sideways with a slight upward bias during the week, gaining nearly 3% on a weekly closing basis. At the time of writing this post, the index is trading with a gain of about 50 points.

The index is trading below its three EMAs in a bear market – as it has done for more than 2 months. The falling 20 day EMA provided good resistance to a couple of attempts by the index to move higher.

Daily technical indicators are giving mixed signals. MACD has crossed above its signal line and is showing upward momentum, but remains inside its oversold zone. RSI is moving sideways below its 50% level. Slow stochastic has moved well above its 50% level, but its upward momentum has stalled.

On longer term weekly chart (not shown), the index closed well below its three weekly EMAs for the fourth straight week, and may have entered a long-term bear market. Weekly technical indicators are in bearish zones.

Saturday, September 12, 2015

BSE Sensex and NSE Nifty 50 index chart patterns – Sep 11, 2015

FIIs remained net sellers of equity during the week, with their net sales exceeding Rs 2800 Crores. DIIs were net buyers of equity worth Rs 2600 Crores. Yet, both Sensex and Nifty closed higher on a weekly basis after 4 straight weeks of lower closes. So, who else bought? As per anecdotal evidence, it was you and me (i.e. small investors).

There was good news on the manufacturing front. The IIP number for July ‘15 was 4.2%, which was a huge improvement over the 0.9% figure of Jul ‘14, but slightly less than the revised figure of 4.4% in Jun ‘15. The consumer non-durables sector was a concern, as it contracted 4.6%.

The Current Account Deficit was lower at $6.2 Billion during Q1 (Jun ‘15) compared with $7.8 Billion in Q1 (Jun ‘14). Lower crude oil prices contributed significantly to the reduction in deficit. The lack of strength in the Rupee has not been commensurate because of falling exports.

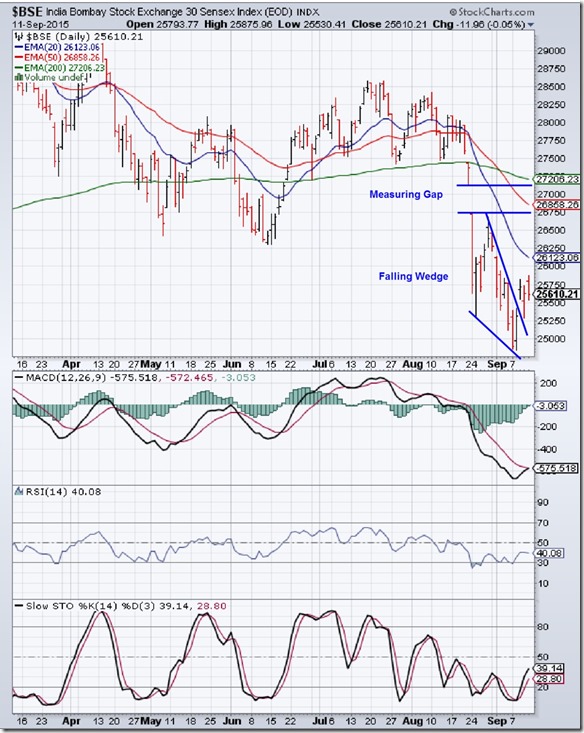
BSE Sensex index chart

Sensex_Sep1115

The daily bar chart pattern of Sensex had formed a downward ‘gap’ on Aug 24 ‘15. It has been trading below the ‘gap’ since then. The ‘death cross’ of the 50 day EMA below the 200 day EMA has technically confirmed a bear market.

However, there is a good chance that the bear market will be a short one – more of a strong correction in a bull market. Why? Because of certain technical patterns formed during the week.

The index touched an intra-day low of 24852 and closed at a 52 week low of 24894 on Mon. Sep 7. On Tue. Sep 8, the index touched a lower intra-day low of 24834 but closed almost 400 points higher – forming a ‘reversal day’ pattern. The 12 days of trading since forming the ‘gap’ was within a ‘falling wedge’ pattern.

On Wed. Sep 9, Sensex broke out above the ‘falling wedge’ with an upward ‘gap’ – thanks to DII buying. A break out with a ‘gap’ is considered to be technically more significant. As often happens after a break out, the index pulled back to the top of the ‘falling wedge’ the next day before bouncing up.

Does that mean the down trend from the Mar ‘15 lifetime high is over? That can only be confirmed once Sensex moves up to fill the ‘gap’ and crosses above its three falling EMAs. Bears (read FIIs) may not allow that to happen any time soon.

Daily technical indicators have corrected oversold conditions but are yet to turn bullish. MACD has moved up to touch its falling signal line inside its oversold zone. RSI bounced up from its oversold zone, but is moving sideways below its 50% level. Slow stochastic is trying to climb up to its 50% level.

Sensex line chart based on daily closing levels (not shown) may be forming an inverse head-and-shoulders reversal pattern, with a neckline at 25750. If the index can close above 25750 with strong volume support, it will provide a good buying opportunity for long-term investors.

NSE Nifty 50 index chart

NIFTY_Sep1115

The weekly bar chart pattern of Nifty formed a ‘reversal bar’ (lower low, higher close) that may have ended the intermediate down move of the past 4 weeks. But it may be too soon to expect an immediate reversal of the 6 months long down trend from the lifetime high touched back in Mar ‘15.

The 20 week and 50 week EMAs are both falling and the index is trading below them as well as below a rare weekly ‘gap’ formed on the chart in the week ending on Aug 28 ‘15. However, the 200 week EMA is still rising, and the index has closed more than 850 points above it. The long-term bull market is intact.

Weekly technical indicators are in bearish zones and looking oversold. MACD and Slow stochastic have dropped to the edge of their oversold zones. RSI has bounced up a bit near the edge of its oversold zone.

The monsoon rain deficiency has caused drought-like conditions in Rajasthan and a couple of other states. Water reservoirs in several states have fallen enough to cause serious concerns. Agricultural output is likely to be affected – so expect food prices to rise. Already price of pulses have reached the three figure mark. That may put a question mark on further interest rate cuts by RBI.

Bottomline? The bar chart patterns of Sensex and Nifty are trading below bearish ‘gaps’, but there are some technical signs of trend reversal. Long-term bull markets are still intact. Stay cautiously optimistic. Maintain stop-losses – whether you decide to add or hold. If FIIs continue their selling spree, all bullish bets will be off.

Thursday, September 10, 2015

Spotting Cash Cows

Before you can spot cash cows, you must understand the true nature of the beast. The good news(?) is that cash cows will never get banned from slaughter. That means, bears can pounce on them at any time. They may get badly hurt, but hardly ever get killed.

A cash cow is a company that generates a lot of free cash flow. That means the cash it generates from its operations comfortably exceeds all its expenses. The actual formula for calculating free cash flow is:

Cash flow from operations – Capital expenditure = Free cash flow

The two items on the left side of the equation can be found from the Cash Flow Statement in Annual Reports. (If you haven’t yet learned how to read the Cash Flow Statement, click on the links at the bottom of this post.)

The lower the capital expenditure, the greater will be the free cash flow. Isn’t capital expenditure necessary for growth? Definitely yes for early-stage companies, which need to chase growth for survival and establish market leadership.

For more mature, stable companies that are sector leaders, high growth may no longer be feasible. They can rely on their existing assets to keep generating profits. Typically, FMCG companies fall in this category.

Aren’t FMCG companies boring and highly priced? Yes to both. But there is a reason for their high price. Due to their large free cash flows, they are usually low-debt or debt-free companies and are able to withstand economic (and market) downturns much better.

Why? Because you will still need to brush your teeth and wash your clothes regardless of the state of the economy and the market.

Read more about how to spot cash cows in this recent article in investopedia.com – and learn whether all cash cows are investment-worthy.

Related Posts

How to read the Cash Flow Statement – Part 1
How to read the Cash Flow Statement – Part 2
A Simple Exercise on Cash Flows
A Solution to the Exercise on Cash Flows

Wednesday, September 9, 2015

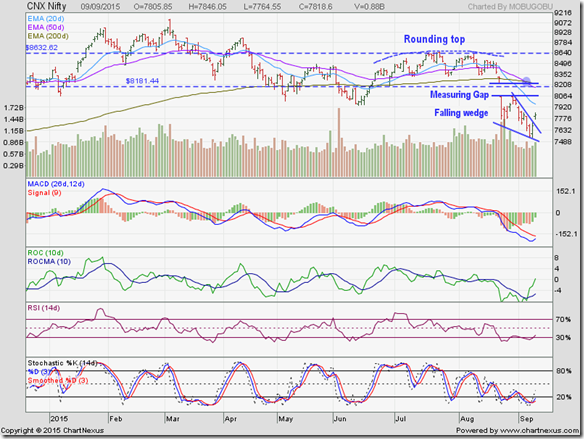
Nifty chart: a mid-week update (Sep 09 ‘15)

Nifty_Sep0915 

The nature of the two ‘gaps’ formed on the daily bar chart pattern of Nifty were explained in last week’s update. The downward target of 7630 for the index was easily met.

Two of the four technical conditions of a bear market have been confirmed. All three EMAs are falling, and the index is trading well below them. The ‘death cross’  of the 50 day EMA below the 200 day EMA (marked by light blue circle) usually confirms a bear market.

However, two more technical confirmations of a bear market are still awaited. Nifty has corrected 17% from its all-time high of 9119, touched on Mar 4 ‘15. A bear market requires at least 20% correction from the top.

Also, the index has retraced almost 40% of its entire rise of 4000 points from its Aug ‘13 low to its Mar ‘15 high. More than a 50% (Fibonacci) retracement is required to confirm a bear market.

So, Nifty will need to fall to 7119 for a long-term trend change from bull to bear. That may not happen just yet due to the following technical developments:

Nifty had touched an intra-day low of 7546 and closed at a new 52 week low of 7559 on Tue. Sep 7 ‘15. The next day, it touched a lower low of 7539, but closed much higher at 7688 with good volume support – forming a ‘reversal day’ pattern that usually ends intermediate down moves.

The entire trading (of 12 sessions) below the ‘measuring gap’ formed a ‘falling wedge’ pattern, from which the index broke out upwards with good volume support and a ‘gap’. A breakout with a ‘gap’ has greater technical significance.

Is the correction over? The technical signs are quite promising, but it is too early to call. Nifty will need to move above the ‘measuring gap’ and its three EMAs into bull territory. That may not happen in a hurry.

Daily technical indicators are in the process of correcting oversold conditions but are yet to turn bullish. MACD is turning up towards its falling signal line inside oversold zone. ROC formed a ‘double bottom’ reversal pattern inside its oversold zone and is poised to enter positive territory.

RSI showed positive divergence by not falling lower with the index, and has just emerged from its oversold zone. Slow stochastic is trying to follow suit.

Bears are unlikely to give up their 6 months long domination of the Nifty chart easily. So, try not to jump into the market feet first. Careful stock selection will determine your returns. Fundamentally strong stocks that have fallen less than the index are likely to perform better.

Tuesday, September 8, 2015

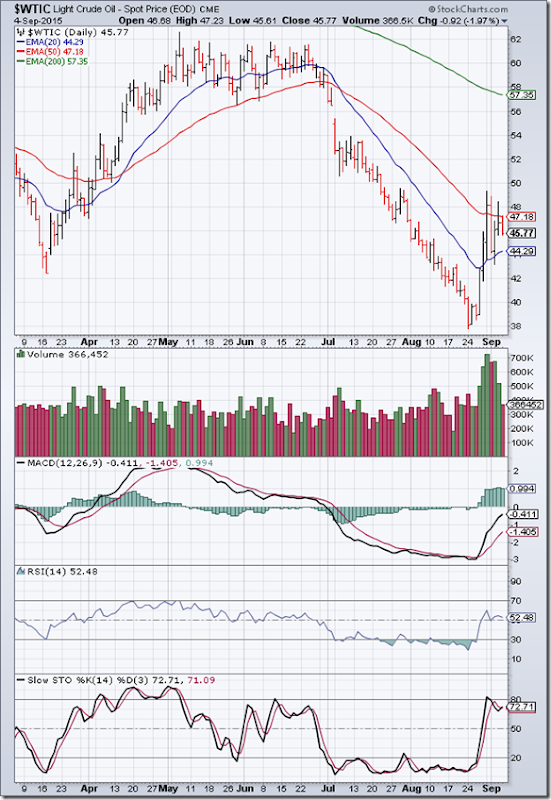
WTI and Brent Crude Oil charts: sharp bear market rallies floundering

WTI Crude chart

WTI Crude_Sep0715

Oversold weekly technical indicators and positive divergences on weekly MACD and RSI had led to the following concluding comment in the previous post on the daily bar chart pattern of WTI Crude: “Any technical bounce is likely to attract more bear selling.”

Oil’s price rose sharply above its 20 day and 50 day EMAs in the last week of Aug ‘15 due to a combination of bottom fishing and short covering, but fell short of the 50 mark. Bear selling emerged as expected. Oil’s price has dropped below its 50 day EMA after a single day’s close above it.

Daily technical indicators have turned bullish, but their upward momentum is stalling. MACD is rising above its signal line in negative zone. RSI and Slow stochastic are above their respective 50% levels.

The ploy by OPEC to keep up with production in an effort to squeeze out US shale oil producers doesn’t seem to be working.

On longer term weekly chart (not shown), oil’s price is trading below its three weekly EMAs in a long-term bear market. Weekly technical indicators have recovered from oversold zones but remain bearish. The technical bounce was triggered by positive divergences in MACD and RSI, which touched higher bottoms while oil’s price dropped lower.

Brent Crude chart

BrentCrude_Sep0715

The daily bar chart pattern of Brent Crude oil climbed quickly above its 20 day and 50 day EMAs - backed by strong volumes – but stopped just short of the 55 level. Bears emerged immediately to push oil’s price down below its 50 day EMA and the 50 level.

Daily technical indicators corrected oversold conditions and briefly turned bullish. MACD is still rising above its signal line in negative zone. RSI has slipped down below its 50% level. Slow stochastic faced resistance from the edge of its overbought zone but is still above its 50% level.

Oil’s price is trading below its falling 50 day and 200 day EMAs, and about to drop below its 20 day EMA in bear territory.

On longer term weekly chart (not shown), oil’s price formed a ‘reversal bar’ (higher high, lower close), and is trading well below its three weekly EMAs in a long-term bear market. Weekly technical indicators corrected oversold conditions but are not showing much upward momentum. Oil’s price is likely to drift downwards.

Monday, September 7, 2015

Stock Index Chart Patterns: S&P 500 and FTSE 100 – Sep 04, 2015

S&P 500 Index Chart

S&P 500_Sep0415

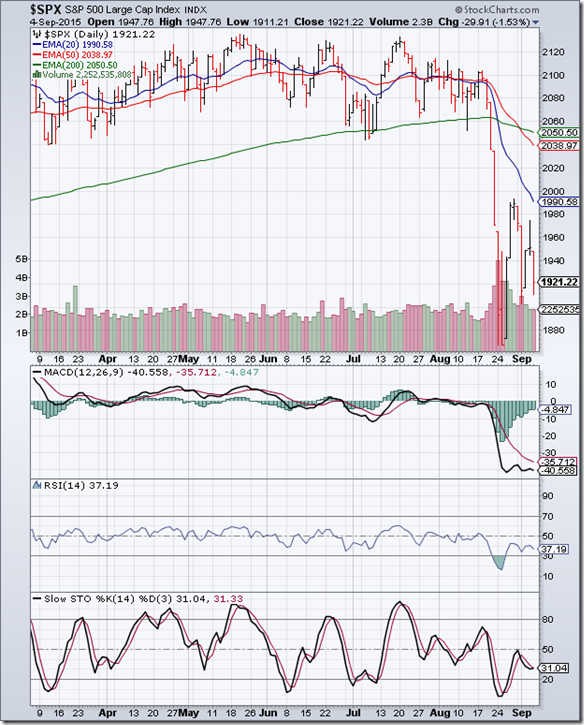
A sharp upward bounce from the previous week’s ‘panic bottom’ on the daily bar chart pattern of S&P 500 failed to attract much follow-up buying. In a volatile trading week, the index dropped down to close almost 3.5% lower for the week.

All three daily EMAs are falling and the index is trading below them. The 50 day EMA has crossed below the 200 day EMA – the ‘death cross’ technically confirming a bear market.

The index had a spectacular bull run – making a lot of money for investors. Long bull runs don’t end suddenly. The first warning was provided back in Oct ‘14, when the index suddenly collapsed below its three EMAs, only to bounced back immediately.

It then went through a sideways consolidation within a ‘rectangle’ for 6 months, touching a lifetime high but giving enough indications of a topping out process. The eventual break down should not have come as a surprise to readers of this blog.

All three technical indicators are in bearish zones and showing downward momentum. Expect the correction to continue. The index is likely to test and breach the Aug ‘15 low of 1867.

On longer term weekly chart (not shown), the index closed well below its falling 20 week and 50 week EMAs but is trading above its rising 200 week EMA in a long-term bull market. Weekly technical indicators are in bearish zones and showing strong downward momentum. The long-term bull market may get reversed.

FTSE 100 Index Chart

FTSE_Sep0415

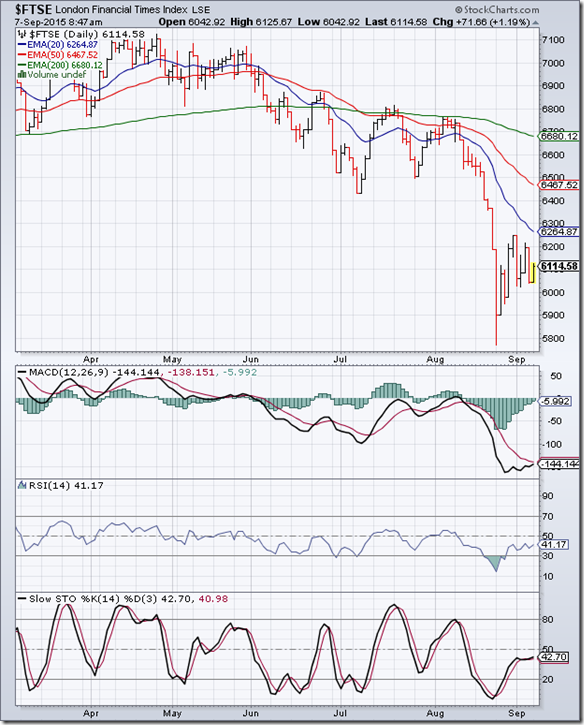
The daily bar chart pattern of FTSE 100 consolidated sideways with a downward bias during the week, losing more than 200 points (3.3%) on a weekly closing basis.

All three daily EMAs are falling and the index is trading below them in a bear market. The Aug ‘15 low of 5768 is likely to be tested and breached.

All three daily technical indicators are in bearish zones. RSI and Slow stochastic have corrected oversold conditions, but MACD is still inside its oversold zone. At the time of writing this post, the index has moved up above the 6100 level.

On longer term weekly chart (not shown), the index closed well below its three weekly EMAs for the third straight week, and has probably entered a long-term bear market. Weekly technical indicators are in bearish zones.

Sunday, September 6, 2015

Sunday musings: the ‘Kunti syndrome’ and its lessons

Stories and anecdotes in the epic Mahabharata give us an idea about the customs and attitudes prevalent in ancient India. They also have lessons for us today because the fallibility of human nature hasn’t changed through the ages.

The story of Krishna’s aunt Kunti is a classic example. Blessed with a mantra from sage Durvasa that enabled her to bear sons with any gods she wished to invoke, she promptly invoked Surya, the Sun god, and bore a son by him.

Ashamed at bearing a son out of wedlock and fearing public disgrace, Kunti put the child in a basket and dumped it in a river – killing it for all practical purposes. Luckily, the child survived and was raised by the charioteer Adhiratha.

The child was named Karna, and grew up to be an expert archer, a valiant warrior, an ally of the Kauravas and a thorn in the flesh of the Pandavas (who had humiliated him because of his supposed lower caste).

Kunti later married Pandu but could not have any children with him because he was rendered impotent by a curse from sage Kimdama. So, after some time, she used Durvasa’s mantra to invoke the gods Dharma, Vayu and Indra and bore three sons by them – named Yudhishthira, Bhima and Arjuna respectively.

But she failed to reveal the true nature of her relationship with Karna to anyone till the Kurukshetra war became imminent. In a desperate attempt to avert the war, she met Karna, admitted that she was his biological mother and appealed to him to break his alliance with the Kauravas.

Karna not only refused her proposal but rebuked her as a self-serving woman who had failed to perform her motherly duties.

When Karna was eventually killed in battle, Kunti told her sons to provide funeral services fit for a king for Karna as he was their half-brother. Needless to say, the Pandavas were dumbfounded that their hated enemy was actually their brother.

‘History’ does not repeat itself – but it tends to follow similar patterns.

Lately, many experts and analysts are pontificating about Pori Bora (a.k.a Indrani Mukherjea) – calling her a disgrace to motherhood for allegedly plotting and murdering her illegitimate daughter Sheena.

But Indrani was probably suffering from the ‘Kunti syndrome’ – being ashamed of bearing children out of wedlock and trying desperately to dodge public disgrace.

Is there a lesson here for investors also? The answer is: Yes.

Impulsive and ‘gut feel’ actions cause big mistakes – specially when you are young, inexperienced and unable to gauge the consequences. Before taking any decision, think, evaluate, consult a known expert.

Instant gratification – whether buying a Harley Davidson on EMI (or stealing it from a showroom faking a test drive) or buying a momentum stock without studying its fundamentals - can cause a temporary adrenaline rush at best.

Long-term wealth building isn’t rocket science. But it requires careful planning, discipline to follow the plan and patience to ride out the ups and downs in the stock market.

Saturday, September 5, 2015

BSE Sensex and NSE Nifty 50 index chart patterns – Sep 04, 2015

Economic slowdown in China and Europe, steep falls in commodity and oil prices, a strong Dollar and likely increase in US interest rates later this month are reasons being put forth by analysts to explain plummeting stock indices in global bourses.

When important technical support levels on stock index charts get breached – the big spenders (read: FIIs) rush towards the exit door. Then margin calls kick in, long positions get hurriedly squared off and panic sets in among small investors.

Both Sensex and Nifty touched new 52 week lows on intra-day, intra-week, daily and weekly closing basis. FIIs net sold Rs 4500 Crores worth equities last week as per provisional figures. DIIs were net buyers of equity worth Rs 4000 Crores.

Is the bull market over? The short answer is: Not yet.

BSE Sensex index chart

Sensex_Sep0415

The daily bar chart pattern of Sensex continued to trade below the ‘measuring gap’ formed on the chart on Aug 24. The index touched and closed at new lows – the possibility was mentioned in last week’s post – and may be slipping into a bear market.

All three EMAs are falling, and the index is trading well below them. The 50 day EMA has crossed below the 200 day EMA (marked by light blue circle) – the ‘death cross’ that technically confirms a bear market.

However, other technical confirmations of a bear market are still awaited. Sensex has corrected 16% from its all-time high of 30025, touched on Mar 4 ‘15. A 20% correction usually signifies a bear market.

Also, the index has retraced about 40% of its entire rise of 12100 points from its Aug ‘13 low to its Mar ‘15 high. More than a 50% Fibonacci retracement is necessary to term it a bear market.

In other words, Sensex will need to fall another 1200 points (to 24000) for a long-term trend change from bull to bear. Can the index fall that far? The answer is: Yes, specially if FIIs remain in sell mode.

Chances are, many fundamentally strong stocks will then appear to be at ‘mouth-watering’ levels – and buyers will surely step in.

All four technical indicators are inside their oversold zones and showing downward momentum. But ROC and RSI are showing positive divergences by touching slightly higher bottoms.

A technical bounce is likely. Will it be a buying opportunity? That will depend on the extent of volume support.

On longer-term weekly chart (not shown), Sensex is trading well above its rising 200 week EMA (which is currently at 23000). The index is undergoing a correction in a long-term bull market. So, dips can be used to add/enter – but with appropriate stop-losses.

NSE Nifty 50 index chart

Nifty_Sep0415

The weekly bar chart pattern of Nifty tried to test the ‘gap’ formed in the last week of Aug ‘15, but faced strong resistance and dropped to a new 52 week low.

The index has corrected a little more than 16% from its Mar ‘15 peak of 9119, and can continue with its correction if FII selling exceeds DII buying.

As per anecdotal evidence from fund house managers, HNIs and small investors, there is no real panic in the market yet. That is usually a sign that the correction isn’t over.

All four weekly technical indicators are in bearish zones and showing downward momentum. Only ROC is inside its oversold zone.

There are no immediate triggers in the market for a sustained rally. The monsoon is rain deficient by 13% so far. Corporate results are unlikely to improve much in Q2 (Sep ‘15). Important reform measures, like GST and land bill, are pending.

Expect volatility to remain high. If you like to play contrarian, be very selective and slowly accumulate instead of buying in one large lot.

Bottomline? The bar chart patterns of Sensex and Nifty continue to trade below bearish ‘gaps’. Long-term bull markets are still intact. If in doubt, stay out. Take a vacation. There is much more to life than the stock market.

Thursday, September 3, 2015

12 Things You Need To Know About Financial Statements

When stock markets are in turmoil, like now – Sensex up 300 points one day and down 500 points the next – the tendency of many small investors is to get paralysed by fear. They tend to sell their stock holdings just when the market nears a bottom.

Fear is a strong emotion that is difficult to control – specially when your hard-earned money is going down the drain. It is also the single most important reason why small investors don’t make as much returns from their stock holdings as they should.

There is of course another important reason why returns from stock investments are often meagre: poor selection of stocks. In a bid to generate outsize returns, small investors chase ‘cheap’ or momentum stocks with non-existent fundamentals.

So, how does one select good stocks? By learning the basics of fundamental analysis. And how does one go about doing that? By studying annual reports of companies. Annual reports analysis can be tedious and boring – but it is an essential skill if you want to invest in stocks.

It requires nothing more than common sense, knowledge of junior school arithmetic and basic accounting concepts. It isn’t rocket science. Thanks to the Internet, annual reports are readily available on company web sites.

To help you get started, here is an article from investopedia.com. Bookmark the article if you are a new stock investor. There are lots of useful links in it that you may wish to go through.

The article can help seasoned investors as well. It is always good to brush up on your fundamental analysis skills. And, who knows? You may even pick up a few new insights.

Related Post

How to read an Annual Report

Wednesday, September 2, 2015

Nifty chart: a mid-week update (Sep 02 ‘15)

Economic slowdown in China, and its possible repercussions on global economic growth, have sent FIIs on a selling spree. Global stock markets are in danger of slipping into bear markets. Some have done so already.

During Aug ‘15, FIIs were net sellers of equity worth a huge Rs 19300 Crores – exceeding their net sales back in Oct ‘08 (when the previous bear market had hit bottom). DIIs were net buyers of equity worth Rs 16300 Crores.

Auto sales in Aug ‘15 were a mixed bag. Hyundai showed good growth. Maruti grew <5%. Tata Motors declared flat sales. M&M and Hero Moto showed double digit degrowth. Medium and heavy commercial vehicle sales are improving, which is a sign of underlying economic growth.

Nifty_Sep0215

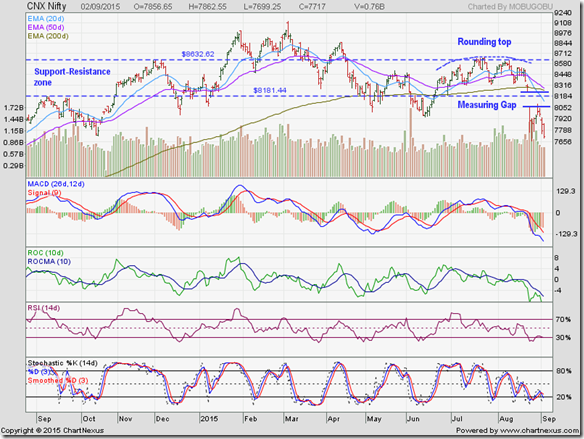
From the 3rd week of Jun ’15, the daily bar chart pattern of Nifty started forming a ‘rounding top’ reversal pattern that ended with a ‘gap’ down fall below its 200 day EMA on Fri. Aug 21. Though the index pulled back to close just above the 200 day EMA inside the ‘support-resistance zone’, a fall with a ‘gap’ below an important support level has strong bearish technical significance.

On Mon Aug 24, the index opened with a bigger 165 points downward ‘gap’ and dropped to a low of 7769, accompanied by a surge in volumes. On Tue Aug 25, it dropped to a lower low of 7667 but closed higher on another strong volume surge - forming a ‘reversal day’ pattern.

On Fri. Aug 28, Nifty pulled back towards the ‘gap’ and partially filled the ‘gap’ on intra-day basis, but closed below the ‘gap’. The ‘gap’ is likely to act as a resistance zone to near-term up moves.

The first, smaller ‘gap’ on Aug 21 is a ‘breakaway gap’. The second, larger ‘gap’ on Aug 24 is a ‘measuring gap’ - which usually occurs in the middle of a down (or up) move.

From the peak of the ‘rounding top’ pattern – from where the current leg of the down move started – to the middle of the ‘measuring gap’ is a fall of about 513 points. The downward target for Nifty is, therefore, 513 points below the middle of the ‘gap’ – i.e. at 7630.

Nifty touched a low of 7667 (which is 37 points above 7630), so the downward target may have been met already. That doesn’t mean the index can’t fall even lower.

Today, Nifty closed at 7717 – which is a 52 week low, and the lowest close since Aug 12 ‘14.

Daily technical indicators are looking bearish and oversold. MACD and ROC are inside their respective oversold zones. RSI and Slow stochastic are about to re-enter their respective oversold zones.

The NSE TRIN, a breadth indicator, is looking quite oversold. It is close to the level last seen when Nifty touched its Jun ‘15 low of 7940. An upward bounce can occur at any time.

On longer-term weekly chart (not shown), Nifty formed a rare weekly ‘gap’ below its 50 week EMA, but is trading well above its rising 200 week EMA in a long-term bull market. Weekly technical indictors are in bearish zones and showing downward momentum.

Tuesday, September 1, 2015

Gold and Silver charts: bear market rallies flatter to deceive

Gold chart pattern

Gold_Aug3115

The daily bar chart pattern of gold rallied past its 20 day and 50 day EMAs to touch an intra-day high of 1170 on Mon. Aug 24 – but failed to test resistance from its falling 200 day EMA and formed a ‘reversal day’ (higher high, lower close) pattern on huge volumes.

The two weeks long sharp bear market rally – triggered by the turmoil in global stock markets – was stopped dead in its tracks. Sellers pounced immediately, and pushed gold’s price below its 20 day and 50 day EMAs into bear territory.

Gold’s price bounced up a little to close exactly on its 50 day EMA, but there is no reason for any bullish hopes. Volumes have trailed off, indicating lack of sufficient buying interest. Expect lower levels soon.

Daily technical indicators are looking neutral to bullish. However, RSI may be forming a bearish ‘head-and-shoulders’ pattern and Slow stochastic has formed a ‘double top’ reversal pattern inside its overbought zone. MACD is in bullish zone but its upward momentum has stalled.

On longer term weekly chart (not shown), gold’s price formed a ‘reversal week’ pattern and closed below all three weekly EMAs in a long-term bear market. Weekly technical indicators are in bearish zones.

Silver chart pattern

Silver_Aug3115

The daily bar chart pattern of silver rose above its 50 day EMA to touch an intra-day high of 15.70 on Fri. Aug 21, but formed a ‘reversal day’ pattern (higher high, lower close) that ended the 3 weeks long bear market rally.

Strong selling dropped silver’s price to a 3 years low of 13.90 on Aug 26. The subsequent bounce on sliding volumes failed to have any impact on bear dominance of silver’s chart.

Silver’s price formed a ‘double top’ reversal pattern, which is more clearly visible on RSI and Slow stochastic indicators. All three indicators are in bearish zones. The low of 13.90 is likely to be tested and breached.

On longer term weekly chart (not shown), silver’s price faced strong resistance from its falling 20 week EMA, and is trading below its three weekly EMAs in a long-term bear market. Technical indicators are in bearish zones.