FIIs were net sellers of equity on Tue. Oct 16, but net buyers on the other two trading days this week. Their total net selling was worth Rs 9.6 Billion. DIIs were net buyers on Mon. & Tue. but net sellers on Wed. Oct 17. Their total net buying was worth Rs 10.1 Billion, as per provisional figures.
India's WPI inflation rose to 5.13% in Sep '18 from 4.53% in Aug '18 and an upwardly revised 5.27% in Jul '18. Higher fuel price was the main culprit.
Consumer goods companies are uncertain about the outlook for rural demand as below-normal monsoon rainfall in some states is set to hit income in rural areas.
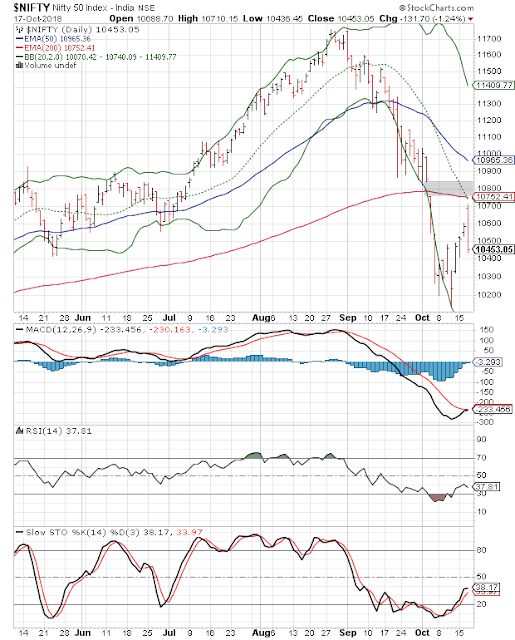
The daily bar chart pattern of Nifty has reverted back to the control of bears. The counter-trend rally from the lower Bollinger Band came to a screeching halt today.
The index touched an intra-day high of 10710 but faced strong resistances from its 200 day EMA, its 20 day SMA (green dotted line) and the downward 'gap' formed on Oct 4. (The bearish and measuring significance of the 'gap' was discussed in last week's post.)
After an intra-day correction of more than 250 points, the index formed a large 'reversal day' bar and a 'bearish engulfing' candlestick that have put paid to any bullish hopes of a further recovery.
Daily technical indicators have corrected oversold conditions but remain in bearish zones. MACD is facing resistance from its falling signal line. RSI is showing downward momentum. The upward momentum of Slow stochastic has stalled.
Nifty's TTM P/E has moved down to 25.19, but still remains higher than its long-term average. The breadth indicator NSE TRIN (not shown) is moving up in neutral zone, suggesting near-term downside.
All three EMAs are moving down, and the index is trading below them in bear territory. It may be early to call this correction the first leg of a bear market. Technical confirmation will be provided by the 'death cross' of the 50 day EMA below the 200 day EMA, and a 20% fall from the Aug 28 top of 11760 (to 9400).
The correction is far from over. Looks like the index wants to test its downward target of the 'measuring gap' at 9850. A little patience may provide better entry points.
No comments:
Post a Comment