The Indian rupee hit another all-time low against the U.S. dollar on Friday, trading at slightly more than 74 rupees to the dollar. The chart below shows the USD/INR currency pair's price action over the last two years, which displays the U.S. dollar's spectacular strength against the Indian rupee, or conversely, the rupee's extreme weakness against the greenback. The Indian currency's precipitous decline started to accelerate at the beginning of this year, when the exchange rate was only around 63 rupees to the dollar. While many major currencies have been weak against a surging U.S. dollar this year, the rupee's weakness has been exceptional.
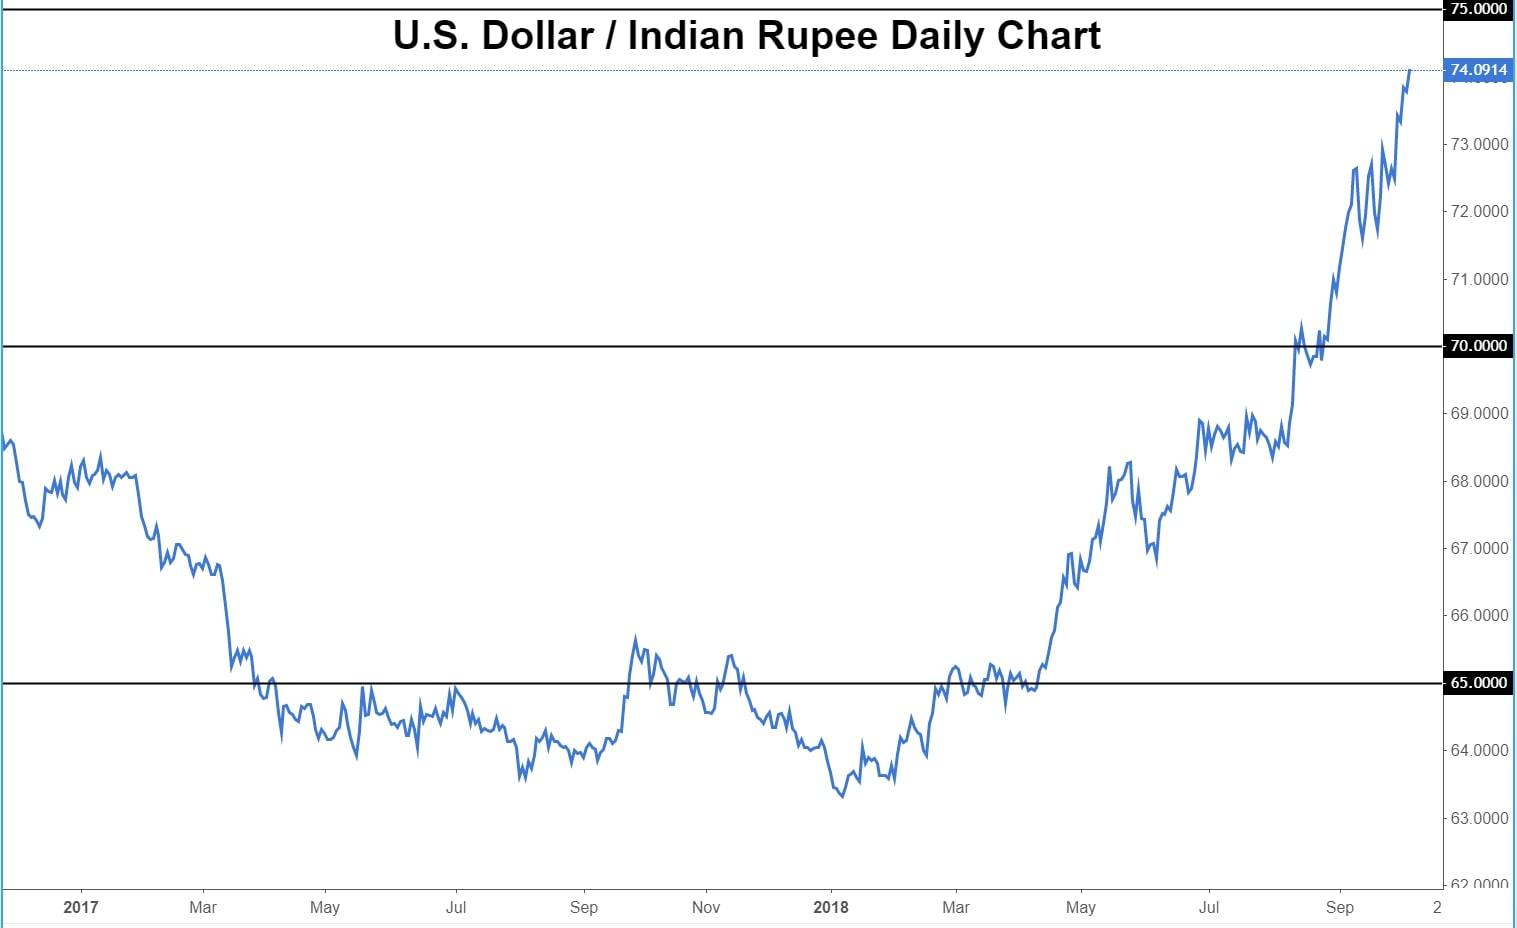 Helping to fuel the latest fall for the rupee was a surprise move by the RBI, which had been widely expected to raise the benchmark interest rate on Friday. Instead, the central bank surprised to the dovish side by opting to keep rates unchanged, which led Indian financial markets, including equities and the rupee, to plunge further. The RBI's lack of action to defend its currency and fend off rising inflation was a shock that the rupee did not need, after already having lost nearly 15% of its value, year to date. The rupee's bleeding will almost certainly slow at some point, but if central bank inaction continues to rule the day, India's currency could have significantly further to fall.
By Caleb Silver, Editor in Chief (The Market Sum, Investopedia.com)
The stock market is in the midst of several major shifts, and investors should begin to reposition their portfolios appropriately, according to a recent report from the U.S. equity and quantitative strategy team at Bank of America Merrill Lynch (BofAML).
"The 20-year long risky stock premium has finally been wiped out," is how their report leads off, continuing, "investors should pay for safety and be compensated for risk, but the opposite has been the case for 20 [years]."
Given their observation that "the gap has finally closed," this has major ramifications for investors going forward. The table below summarizes five big market trends that BofAML sees as being underway right now.
Read more at:
https://www.investopedia.com/news/raging-bull-market-over-so-whats-next/
FIIs were net sellers of equity on the two trading days (Mon. & Wed.) this week. Their total net selling was worth Rs 33.9 Billion. DIIs were net buyers on both days. Their total net buying was worth Rs 32.1 Billion, as per provisional figures.
Nikkei India's Manufacturing PMI strengthened to 52.2 in Sep '18 from 51.7 in Aug '18. (A figure greater than 50 means expansion). GST collections rose to Rs 944 Billion in Sep '18 from Rs 937 Billion in Aug '18.
Auto sales during Sep '18 were a mixed bag. Bajaj Auto, Hero Moto, TVS Motors, Tata Motors, Ashok Leyland showed good growth. Eicher Motors, Maruti, Escorts, M&M disappointed.
Providing some respite for bulls, the daily bar chart pattern of Nifty found good downside support from the zone between 10800 and 10900, and closed above its 200 day EMA in bull territory.
The 20 day EMA has crossed below the 50 day EMA - just as it did in Feb '18. A deeper correction below the 200 day EMA had followed then. The pattern may repeat this time as well.
On the downside, expect stronger support from 'Support/Resistance zone 2' (between 10400 and 10600). In case Nifty falls below 10400, it may test its Mar '18 low. That may lead to a change of trend from bullish to bearish.
If there is a technical bounce from the current level, the falling 20 day and 50 day EMAs are likely to provide resistance.
Daily technical indicators are looking bearish and oversold. MACD is falling below its signal line inside its oversold zone. RSI is seeking support from the edge of its oversold zone. Slow stochastic has re-entered its oversold zone. A technical bounce is a possibility, but it may not be a strong one.
Nifty's TTM P/E has moved down to 26.26, but still remains much higher than its long-term average. The breadth indicator NSE TRIN (not shown) is moving up in neutral zone, suggesting more correction.
Macro headwinds - like a falling Rupee, rising oil price, widening fiscal deficit - are showing no signs of abating. With election season in the offing, which is creating more uncertainty, only decent Q2 (Sep '18) results may help the market recover from its doom and gloom sentiment.
WTI Crude Oil chart
The daily bar chart pattern of WTI Crude Oil received twin support from its 20 day and 50 day EMAs and rose to touch a 52 week high of 75.91 on Oct 2, but formed a small 'reversal day' bar (higher high, lower close).
All three EMAs are rising, and oil's price is trading above them in a bull market. Trump's exhortation to OPEC to hike production and put a lid on oil's price appears to have fallen on deaf ears.
Daily technical indicators are looking quite overbought, and can trigger a correction. Note the 'double bottom' reversal pattern on Slow stochastic that preceded the recent rally.
On longer term weekly chart (not shown), oil's price closed above its three weekly EMAs in long-term bull territory. Weekly technical indicators are looking bullish and showing upward momentum.
Brent Crude Oil chart
The daily bar chart pattern of Brent Crude Oil received good support from its 20 day EMA and soared to a 52 week high of 85.45 on Oct 1, before closing a bit lower.
All three EMAs are rising, and oil's price closed above them in a bull market. The almost vertical rally during the past two weeks is unsustainable. A correction may follow.
Daily technical indicators are inside their respective overbought zones. A pullback towards 80 is a possibility.
On longer term weekly chart (not shown), oil's price closed above its three rising weekly EMAs in long-term bull territory. Weekly technical indicators are looking bullish and overbought - hinting at a pullback.
S&P 500 index chart pattern
Possibility of a corrective move towards the lower Bollinger Band was mentioned in last week's post on the daily bar chart pattern of S&P 500. Instead, the index found support at its 20 day SMA (blue dotted line) and consolidated sideways - losing about 16 points (0.5%) on a weekly closing basis.
The index is trading well above its rising 50 day and 200 day EMAs in a bull market, but closed lower in 4 out of 5 trading days during the week. Despite trading near a lifetime high, the index is facing difficulty in shaking the bears off.
Daily technical indicators are in bullish zones, but showing downward momentum. MACD has slipped below its signal line. RSI has fallen towards its 50% level. Slow stochastic has dropped from its overbought zone. A correction towards the lower Bollinger Band remains a possibility.
On longer term weekly chart (not shown), the index closed above its three rising weekly EMAs in a long-term bull market. Weekly technical indicators are looking overbought, and not showing any upward momentum.
FTSE 100 index chart pattern
The daily bar chart pattern of FTSE 100 managed to prevent the 'death cross' of the 50 day EMA below the 200 day EMA by closing above all three EMAs in bull territory, gaining about 20 points (0.3%) on a weekly closing basis.
The merged 50 day and 200 day EMAs have put the brakes on the index rally. At the time of writing this post, the index is trading just 6 points higher.
Daily technical indicators are not giving bulls much hope. MACD is above its rising signal line, but its upward momentum has slowed after entering bullish zone. RSI's up move has stalled after crossing above its 50% level. Stochastic has begun to correct inside its overbought zone.
Expect the index to consolidate a bit longer before it can make a decisive directional move. The three EMAs are converging - a technical condition that is usually a harbinger of a sharp up or down move.
On longer term weekly chart (not shown), the index closed just below its 20 week EMA but above its 50 week and 200 week EMAs in a long-term bull market. Weekly MACD is moving sideways in neutral zone. RSI and Stochastic are also moving sideways near their respective 50% levels.
FIIs were net buyers of equity on Thu. (Sep 27), but net sellers on the other four days. Their total net selling was worth Rs 37.1 Billion. DIIs were net sellers of equity on Thu. but net buyers on the other four days. Their total net buying was worth a huge Rs 84.4 Billion, as per provisional figures.
Demand for services and manufactured goods slowed in Aug. '18, while a cross-section of high-frequency indicators compiled by Bloomberg News suggest economic growth may moderate in the coming months from an 8%-plus pace in the Apr-Jun '18.
A recent report by the United Nations Conference on Trade and Development (UNCTAD) stated that trade tariff tussle between USA and China is a symptom of a "deeper malaise". The report added that four BRICS nations, including India, are doing better because of their domestic demands.
BSE Sensex index chart pattern
After the panic selling on Fri. Sep 21, the daily bar chart pattern of Sensex got some respite from bears by consolidating sideways in a range during the week. On Fri. Sep 28, the index slipped 8 points below the low of 35993 touched on Sep 21 - proving the market adage 'Panic bottoms seldom hold'.
Daily technical indicators are looking bearish and oversold. MACD is falling below its signal line in bearish zone. ROC is below its falling 10 day MA in oversold zone. RSI and Slow stochastic have re-entered their respective oversold zones. Any technical bounce may encounter more bear selling.
The support zone mentioned in last week's post - based on 50% and 61.8% Fibonacci retracement levels of the rally from the Mar '18 low and Aug '18 top - has been marked on the chart. The 200 day EMA is inside the support zone.
Bulls can be expected to put up a fight to defend the support zone. Note that heavy buying by DIIs during the week failed to prevent the index from touching a lower low. That is a clear indication that HNIs and small investors have joined FIIs in rushing through the exit door.
Stay calm and sit on the sidelines. If you have spare savings that you are waiting to invest, wait a little longer. The prudent thing to do would be to buy when the market is on the way up than when it is on the way down.
NSE Nifty index chart pattern
The weekly bar chart pattern of Nifty closed lower for the fourth straight week, touching a low of 10850 before bouncing up to close within the downward-sloping trading channel. The index closed below its 20 week EMA for the first time in 6 months.
Nifty closed above its 50 week EMA in long-term bull territory. Any further correction should get support from the zone between 10850 and 10550. In case the index falls below 10550, it can drop to test its Mar '18 low.
Weekly technical indicators have corrected overbought conditions and are showing downward momentum. MACD has crossed below its signal line and has fallen from its overbought zone. ROC has crossed below its 10 week MA and has dropped to its neutral zone. RSI and Slow stochastic have also dropped to their respective neutral zones.
Nifty's TTM P/E has come down to 26.44, but remains above its long-term average in overbought territory. The breadth indicator NSE TRIN (not shown) is falling in neutral zone, and can trigger a pullback.
Bottomline? The corrective downward moves on Sensex and Nifty charts have dropped near strong support zones. Technical bounces are likely, but bears may use them to sell again. Macro headwinds - like rising oil prices, a depreciating Rupee, widening trade and fiscal deficits, ongoing debt woes of IL&FS - remain concerns for bulls. Time to sit on the sidelines and wait for the indices to find bottoms.


