S&P 500 index chart pattern
The daily bar chart pattern of S&P 500 consolidated sideways within a 27 points range during the first four trading days, but formed an upward 'gap' to close above the 2900 level on Fri. Apr 12.
It was the first close above 2900 in more than 6 months. A new high is now within handshaking distance. But bears are still not ready to throw in the towel.
Trading pattern during the past 6 weeks has formed a bearish 'rising wedge' from which a downward breakout is likely. A correction will improve the technical 'health' of the chart - enabling the index to rise to a new high.
Daily technical indicators are looking bullish and overbought. MACD is moving sideways above its signal line. RSI is making another attempt to enter its overbought zone. Slow stochastic is well inside its overbought zone.
All three EMAs are rising and the index is trading well above them in a bull market. However, negative divergences visible on all three indicators - which failed to rise to new highs with the index - can trigger some correction or consolidation.
On longer term weekly chart (not shown), the index closed above its three weekly EMAs in a long-term bull market for the 11th week in a row. Weekly MACD is rising above its signal line bullish zone. RSI is moving up above its 50% level. Slow stochastic is well inside its overbought zone.
FTSE 100 index chart pattern
The daily bar chart pattern of FTSE 100 consolidated sideways during the week. The possibility was mentioned in last week's post.
The index touched the week's high of 7478 on Tue. Apr 9, but formed a 'reversal day' bar (higher high, lower close) that triggered a mini correction towards the rising 20 day EMA on Thu. Apr 11.
A bounce up on Fri. Apr 12 to a close at 7437 could not prevent FTSE from sustaining a 10 points loss for the week. However, the 'golden cross' of the 50 day EMA above the 200 day EMA has technically confirmed a return to a bull market.
Daily technical indicators are in bullish zones but not showing much upward momentum. MACD is sliding down towards its rising signal line. RSI remains below the edge of its overbought zone. Stochastic is inside its overbought zone. Some more consolidation is possible.
The BrExit 'can' has been kicked down the road. Since UK will now remain in the EU till Oct 31st, they will participate in the European parliamentary elections next month. This uncomfortable reality is dawning on Europeans.
On longer term weekly chart (not shown), the index closed above its three weekly EMAs in long-term bull territory for the fourth straight week. Weekly technical indicators are looking bullish. MACD is rising above its signal line in bullish zone. RSI is rising towards its overbought zone. Stochastic is well inside its overbought zone.
S&P 500 index chart pattern
The following comments were made in last week's post on the daily bar chart pattern of S&P 500: "A convincing move above 2875 will clear the path for the index to touch a new high. Bears may continue to yield ground grudgingly."
After facing resistance near the 2875 level during the first four trading days, the index rose to close at 2893 on Fri. Apr 5 - gaining 2% on a weekly closing basis. It seems just a matter of time before the index rises to a new lifetime high.
Daily technical indicators are looking bullish and overbought. MACD is rising above its signal line. RSI looks ready to enter its overbought zone. Slow stochastic is inside its overbought zone.
All three EMAs are moving up, and the index is trading above them in a bull market. However, negative divergences visible on all three indicators - which failed to rise to new highs with the index - can trigger some correction or consolidation.
On longer term weekly chart (not shown), the index closed above its three weekly EMAs in a long-term bull market for the tenth week in a row. Weekly MACD is rising above its signal line bullish zone. RSI is moving up above its 50% level. Slow stochastic remains well inside its overbought zone.
FTSE 100 index chart pattern
The daily bar chart pattern of FTSE 100 moved convincingly above its three EMAs and touched a high of 7461 on Fri. Apr 5, but closed just below 7450 - with a gain of 2.3% on a weekly closing basis.
The 50 day EMA is about to cross above the 200 day EMA - the 'golden cross' that will technically confirm a return to a bull market. Trading volumes on Thu. and Fri. were below the long-term average. Some correction or consolidation is possible.
Daily technical indicators are looking bullish. MACD has crossed above its signal line in bullish zone. RSI is hovering near the edge of its overbought zone. Stochastic is inside its overbought zone.
With just 5 days to go until UK is due to leave the EU, Labour Party is hoping for further talks with the government to finalise a BrExit deal. Only a cross-party pact will get the support of a majority of MPs, according to PM May.
On longer term weekly chart (not shown), the index closed above its three weekly EMAs in long-term bull territory for the third straight week. Weekly technical indicators are looking bullish. MACD is rising above its signal line and has entered bullish zone. RSI is rising towards its overbought zone. Stochastic is well inside its overbought zone.
S&P 500 index chart pattern
The 'V' shaped recovery rally on the daily bar chart pattern of S&P 500 continues to face resistance from bears. Bulls have managed to overcome the resistance zone between 2800-2825 after five weeks of struggle.
The next resistance zone between 2850-2875 is looming above. A convincing move above 2875 will clear the path for the index to touch a new high. Bears may continue to yield ground grudgingly.
Daily technical indicators are in bullish zones after correcting overbought conditions, but are not showing much upward momentum. MACD is below its sliding signal line. RSI has bounced up from neutral zone. Slow stochastic is moving sideways after falling from its overbought zone.
Negative divergences on all three indicators - which failed to touch new highs with the index - triggered a correction below the rising 20 day EMA.
On longer term weekly chart (not shown), the index closed above its three weekly EMAs in a long-term bull market for the ninth week in a row. Weekly MACD is rising above its signal line bullish zone. RSI is moving sideways above its 50% level. Slow stochastic remains well inside its overbought zone.
FTSE 100 index chart pattern
The daily bar chart pattern of FTSE 100 made a valiant effort to cross above its 200 day EMA and stay in bull territory, but faced profit booking and dropped to seek support from its rising 50 day EMA. The index has since bounced up to close above its three EMAs in bull territory.
After touching a low of 6536.53 on Dec 27 '18, FTSE has formed a bullish pattern of 'higher tops, higher bottoms' and gained more than 830 points (12.8%) by touching a high of 7370.61 on Mar 21 '19.
Daily technical indicators are looking bullish. MACD is trying to cross above its signal line after falling below it in bullish zone. RSI is rising above its 50% level after correcting from the edge of its overbought zone. Stochastic is also rising above its 50% level after falling from its overbought zone.
The BrExit process appears to be heading towards a messy end. The British PM got an extension of time at the EU summit on Mar 21, and is pondering a fourth bid to get a deal passed by Parliament.
On longer term weekly chart (not shown), the index closed above its three weekly EMAs in long-term bull territory for the second straight week. Weekly technical indicators are looking bullish. MACD is rising above its signal line and has reached neutral zone. RSI is rising above its 50% level. Stochastic is inside its overbought zone.
S&P 500 index chart pattern
The daily bar chart pattern of S&P 500 shows that bulls are trying their best to break free from bear domination. The index bounced up after receiving support from its 50 day EMA, and made another attempt to climb above the resistance zone (between 2800 and 2825).
After a brief setback on Thu. Mar 14, the index rose to touch an intra-day high of 2831 - its highest level in 5 months - but failed to sustain above the resistance zone.
The index closed above its three EMAs in a bull market, gaining 2.9% on a weekly closing basis. Friday's volume spike may be a sign of a 'buying climax'.
Daily technical indicators are looking bullish. MACD is ready to cross above its falling signal line in bullish zone. RSI is rising towards its overbought zone. Slow stochastic is inside its overbought zone.
All three indicators are showing negative divergences by failing to touch new highs with the index. Some consolidation or correction may follow.
On longer term weekly chart (not shown), the index closed above its three weekly EMAs in a long-term bull market for the seventh week in a row. Weekly MACD has entered bullish zone. RSI has bounced up after receiving support from its 50% level. Slow stochastic is inside its overbought zone.
FTSE 100 index chart pattern
The daily bar chart pattern of FTSE 100 received good support from its rising 50 day EMA on Tue. Mar 12, and rose to touch an intra-day high of 7244 on Fri. Mar 15 - but failed to overcome strong resistance from its 200 day EMA.
The index gained 1.7% on a weekly closing basis. However, the volume spike on Friday may be a sign of a 'buying climax'.
Daily technical indicators are looking bullish. MACD is poised to cross above its falling signal line in bullish zone. RSI is rising above its 50% level. Stochastic has entered its overbought zone. FTSE may make another attempt to cross above its 200 day EMA.
Uncertainty regarding the BrExit process continues. The British PM may ask for an extension of time (beyond Mar 29) at the EU summit on Mar 21.
On longer term weekly chart (not shown), the index received support from its 20 week EMA and bounced up to close above its three weekly EMAs in long-term bull territory.
Weekly technical indicators are looking bullish. MACD is rising above its signal line in bearish zone. RSI has bounced up after receiving support from its 50% level. Stochastic has re-entered its overbought zone.
S&P 500 index chart pattern
The following comment appeared in last week's post on the daily bar chart pattern of S&P 500: "...the index closed above its three weekly EMAs in a long-term bull market for the fifth week in a row, but has formed a long-legged doji candlestick pattern that can halt the rally."
On Mon. Mar 4, the index touched an intra-day high of 2817, but formed a 'reversal day' bar by closing below the resistance zone (between 2800 and 2825). That was just the excuse bears needed to swing into action.
The index corrected during the rest of the week, falling below its 20 day EMA but receiving support from its 50 day and 200 day EMAs. The 'golden cross' of the 50 day EMA above the 200 day EMA has not been a convincing one. The index lost 2.2% on a weekly closing basis.
Daily technical indicators are looking bearish after correcting overbought conditions. MACD is falling below its signal line in bullish zone. RSI is seeking support from its 50% level. Slow stochastic has fallen sharply below its 50% level.
Signs of a global economic slowdown - if not a recession - and a not-so-great jobs report have taken the wind out of bullish sails. A possible fall below the 200 day EMA can lead to more correction.
On longer term weekly chart (not shown), the index closed above its three weekly EMAs in a long-term bull market for the sixth week in a row, but has formed a large 'reversal' bar (higher high, lower close) that can trigger a correction.
Weekly MACD is in neutral zone. RSI has formed a small 'rounding top' reversal pattern and dropped towards its 50% level. Slow stochastic has started to correct inside its overbought zone.
FTSE 100 index chart pattern
The daily bar chart pattern of FTSE 100 rose to touch an intra-day high of 7212 on Wed. Mar 6, but fell short of testing resistance from its 200 day EMA. The index dropped to seek support from its rising 50 day EMA, and closed just above 7100 - losing only 2 points for the week.
Daily technical indicators are looking bearish. MACD is falling below its signal line in bullish zone. RSI has again dropped to seek support from its 50% level. Stochastic is falling towards its oversold zone.
The unresolved BrExit deal continues to affect bullish sentiments. The index can consolidate or correct some more.
On longer term weekly chart (not shown), the index received support from its 20 week EMA but faced resistance from its 50 week EMA, and closed above its 200 week EMA in long-term bull territory.
Weekly technical indicators are giving conflicting signals. MACD is rising above its signal line in bearish zone. RSI is seeking support from its 50% level. Stochastic has slipped down from its overbought zone.
S&P 500 index chart pattern
The following comments were made in last week's post on the daily bar chart pattern of S&P 500: "Some more consolidation can be expected before the index makes an attempt to cross above the resistance zone."
The index entered the resistance zone (between 2800 and 2825) On Mon. Feb 25 and touched an intra-day high of 2813, but dropped to close below 2800. Three days of consolidation with a downward bias followed, with the index touching an intra-day low of 2775 on Wed. Feb 27.
An upward bounce on Fri. Mar 1 - possibly because POTUS postponed increasing tariffs on Chinese goods - took the index to a close inside the resistance zone after 4 months, with a weekly gain of 0.4%.
Bears have managed to prevent the 'golden cross' of the 50 day EMA above the 200 day EMA for one more week by strongly defending the resistance zone.
Daily technical indicators are looking overbought. MACD has slipped below its signal line (which appears to be forming a 'rounding top' reversal pattern) near the edge of its overbought zone. RSI continues to face resistance from the edge of its overbought zone. Slow stochastic has bounced up from the edge of its overbought zone.
The index has taken more than two months to recover from three weeks of sharp correction in Dec '18. Some more consolidation is possible before the index can cross above the resistance zone.
On longer term weekly chart (not shown), the index closed above its three weekly EMAs in a long-term bull market for the fifth week in a row, but has formed a long-legged doji candlestick pattern that can halt the rally.
Weekly MACD has risen to its neutral zone. RSI is moving sideways above its 50% level. Slow stochastic is climbing inside its overbought zone, and can trigger a correction.
FTSE 100 index chart pattern
The daily bar chart pattern of FTSE 100 failed to overcome strong resistance from its 200 day EMA and corrected below its 20 day EMA. It touched the week's low of 7041 on Thu. Feb 28, but found support from its 50 day EMA.
A weak technical bounce on Fri. Mar 1 faced resistance from the 20 day EMA. The index managed to close just above 7100, with a 1% loss on a weekly closing basis.
It was the second straight lower weekly close. Strong volumes on the three down days is a clear sign of bear domination.
Daily technical indicators are looking bearish after correcting overbought conditions. MACD has formed a 'rounding top' reversal pattern and is falling below its signal line in bullish zone. RSI has dropped to seek support from its 50% level. Stochastic has emerged from its oversold zone.
Uncertainty about a possible no-deal BrExit is affecting bullish sentiments. The index may consolidate some more. (At the time of writing this post, FTSE is trading about 16 points higher.)
On longer term weekly chart (not shown), the index closed above its 20 week and 200 week EMAs in long-term bull territory, but below its 50 week EMA. Weekly technical indicators are turning bearish. MACD is rising above its signal line in bearish zone. RSI has dropped to seek support from its 50% level. Stochastic has fallen down from its overbought zone.
S&P 500 index chart pattern
The following comments were made in last week's post on the daily bar chart pattern of S&P 500: "The 'golden cross' of the 50 day EMA above the 200 day EMA will technically confirm a bull market. Bears may try to prevent that from occurring by defending the 'resistance zone' between 2800 and 2825.."
In a holiday-shortened trading week, the index consolidated sideways with a slight upward bias and gained 0.6% on a weekly closing basis. However, bears defended the 'resistance zone' well and prevented the 'golden cross' for the time being.
Daily technical indicators are looking overbought. MACD is rising above its signal line in overbought zone. RSI is facing resistance from the edge of its overbought zone. Slow stochastic is moving sideways inside its overbought zone, but is showing negative divergence by touching a lower top.
Some more consolidation can be expected before the index makes an attempt to cross above the resistance zone. Satisfactory resolution of the US-China trade spat may provide the necessary incentive to bulls.
On longer term weekly chart (not shown), the index closed above its three weekly EMAs in a long-term bull market for the fourth week in a row. Weekly MACD is rising above its signal line in bearish zone. RSI is rising above its 50% level. Slow stochastic is climbing inside its overbought zone. Some more upside is possible.
FTSE 100 index chart pattern
The pullback rally on the daily bar chart pattern of FTSE 100 stalled at the 200 day EMA. The index consolidated sideways as it struggled to move above the 7200 level, and eventually closed below it with a weekly loss of 0.8%.
Daily technical indicators are correcting overbought conditions. MACD has crossed below its signal line in bullish zone. RSI has dropped down after facing resistance from the edge of its overbought zone. Stochastic has fallen from its overbought zone after re-entering it.
The BrExit negotiations may be headed for a hard landing. Some more index consolidation or correction is likely. (At the time of writing this post, FTSE is trading about 9 points higher.)
On longer term weekly chart (not shown), the index closed above its 20 week and 200 week EMAs in long-term bull territory, but slipped down below its 50 week EMA. Weekly technical indicators are looking bullish. MACD is rising above its signal line in bearish zone. RSI is above its 50% level and Stochastic is inside its overbought zone, but both are showing slight downward momentum.
FIIs were net buyers of equity on Mon. and Wed. (Jan 28 and 30) but net sellers on Tue. Their total net selling was worth only Rs 6.7 Million. DIIs were net buyers of equity on all three trading days. Their total net buying was worth Rs 6.7 Billion, as per provisional figures.
India's economic activity showed signs of slowing down in Dec '18, reflecting a pullback in new orders and belying hopes of a quick turnaround suggested by Nov '18 data.
According to ICRA, as many as 898 corporate insolvency cases are awaiting resolution as of Dec '18, up from 768 cases as on Sep '18. Only 79 cases have yielded a resolution, while 302 cases have entered liquidation as of Dec '18.
A false upward breakout from a 'diamond' pattern (refer last week's technical update) on the daily bar chart pattern of Nifty has effectively ended the counter-trend rally from its Oct '18 low.
The index has resumed the next leg of its down move from its Aug '18 top. That sounds rather ominous for bulls, and so it should be.
The sharp index fall on Mon. Jan 28 not only breached the 200 day EMA, but also gave a breakout below the large 'rising wedge' pattern within which the index was trading during the previous 15 weeks.
The Bollinger Bands are widening, and the 20 day SMA (green dotted line) and 50 day EMA have started moving down towards the 200 day EMA. Today's pullback from the lower Bollinger Band faced twin resistances from the 200 day EMA and the lower edge of the 'wedge'.
Daily technical indicators are in bearish zones. MACD has dropped below its signal line and entered bearish zone. RSI has dropped below its 50% level. Slow stochastic has entered its oversold zone, and may have triggered today's mild pullback attempt.
Nifty's TTM P/E has moved down to 25.84 - but remains much higher than its long-term average in overbought zone. The breadth indicator NSE TRIN (not shown) is rising in neutral zone - hinting at near-term consolidation or correction.
Economic slowdown in China and an aggressive US stance in their tariff war can lead to a domino effect in the global economy. A likely no-deal BrExit is another joker in the pack. The Indian stock market has not yet discounted the possibility of a coalition government after the general elections. (Why else would Nifty be trading at such a high valuation?)
A test of support from the Oct 26 '18 low of 10004.50 is looking well within the realms of possibility. (Bears will have a field day if 10000 gets breached!)
S&P 500 index chart pattern
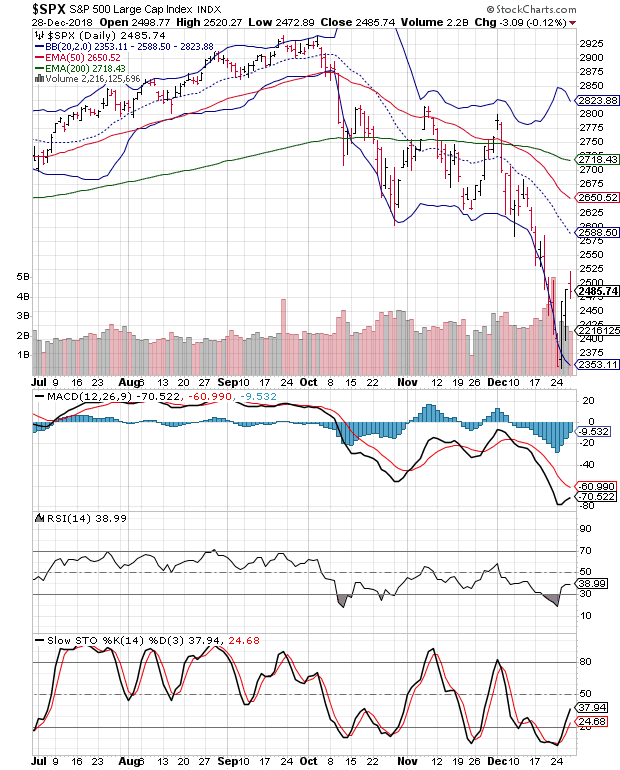
The following comments were made in last week's post on the daily bar chart pattern of S&P 500: "A spike in trading volumes is possibly an indication of a 'selling climax'. A technical bounce may follow."
After closing below the lower Bollinger Band at 2351 on Dec 24 - a 20% correction from the (Sep 21) top of 2941 that confirms a bear market - the index recovered strongly on Boxing Day.
It first touched a new low of 2347, and then recovered 121 points to close at 2468. Formation of a 'reversal day' bar (lower low, higher close) encouraged bulls to embark on a pullback rally that touched the holiday-shortened week's high of 2520 on Fri. Dec 28.
The index closed with a weekly gain of 69 points (2.9%), but formed a small 'reversal day' bar (higher high, lower close) that may bring the pullback rally to an end. The index is trading well below its 200 day EMA in a bear market.
Daily technical indicators are correcting oversold conditions. MACD is rising towards its falling signal line inside its oversold zone. RSI and Slow stochastic have emerged from their respective oversold zones. Bears are likely to use the pullback to sell.
On longer term weekly chart (not shown), the index dropped below its 200 week EMA intra-week, but bounced up to close higher, forming a 'reversal' bar. Weekly technical indicators are looking oversold. MACD is falling inside its oversold zone. RSI has bounced up from the edge of its oversold zone. Slow stochastic has turned up inside its oversold zone.
FTSE 100 index chart pattern
In a X'mas-holiday shortened trading week, the daily bar chart pattern of FTSE 100 touched a 2 years low of 6536 on Thu. Dec 27, but a pullback rally enabled a 13 points gain for the week.
The index continues to trade below its three falling EMAs in a bear market. Any attempt by bulls to progress further is likely to face more bear selling. Expect volatility to continue till the BrExit issue is settled.
Daily technical indicators are turning bullish. MACD is moving up towards its sliding signal line in bearish zone. RSI is rising towards its 50% level. Stochastic has climbed above its 50% level.
On longer term weekly chart (not shown), the index fell to a 2 years low before a sharp pullback to close above 6700. It remains well below its three weekly EMAs in long-term bear territory. Weekly technical indicators are bearish. MACD is falling inside its oversold zone. RSI is hovering near the edge of its oversold zone. Stochastic is trying to emerge from its oversold zone, hinting at some index upside.
S&P 500 index chart pattern
The daily bar chart pattern of S&P 500 shows how technical analysis signals can sometimes be self-fulfilling. The index made a strong 62% gain (~1131 points) during its 33 months long rally from the Feb 11 '16 low of 1810.10 to the Sep 21 '18 top of 2940.91.
Almost half of those gains (532.36 points; 47%) got wiped out in just 3 months when the index touched an intra-day low of 2408.55 on Dec 21 '18. Note how the bottom seems to have fallen out of the index after the bearish 'death cross' (of the 50 day EMA below the 200 day EMA) on Dec 10th.
Daily technical indicators are looking oversold. MACD is falling deep inside its oversold zone. RSI is also falling inside its oversold zone. Slow stochastic has dropped well inside its oversold zone. Bears have taken complete control of the chart.
The 50% Fibonacci retracement level of the 33 months long rally (from Feb '16 low to Sep '18 top) is at 2375. Expect bulls to put up a fight to defend that level. But the fight may not last long when bears are on the rampage.
On longer term weekly chart (not shown), the index dropped to test support from its 200 week EMA for the first time since Feb '16. A spike in trading volumes is possibly an indication of a 'selling climax'. A technical bounce may follow. Weekly technical indicators are looking oversold and showing negative divergences by falling below their Feb '16 lows.
FTSE 100 index chart pattern
The daily bar chart pattern of FTSE 100 continued its corrective move, and touched a 2 years low of 6646 on Thu. Dec 20 but managed to close above 6700.
On Fri. Dec 21, the index formed an 'inside day' candlestick pattern (lower high, higher low) - which indicates indecision among bulls and bears - and closed slightly higher. On a weekly closing basis, the index lost 124 points (1.8%).
BrExit uncertainty is increasing by the day, and the British PM's prospects of getting her BrExit deal through Parliament are looking bleak.
Daily technical indicators are bearish. MACD is sliding down below its signal line in bearish zone. RSI is falling below its 50% level. Stochastic is inside its oversold zone.
All three indicators showed positive divergences by not falling lower with the index. But don't expect a rally anytime soon, as bears are selling on every rise.
On longer term weekly chart (not shown), the index closed below its three weekly EMAs in long-term bear territory, but appears to have found temporary support at 6700. Weekly technical indicators are bearish and showing downward momentum. MACD and Stochastic are falling inside their respective oversold zones. RSI is seeking support from the edge of its oversold zone.
(Wishing all blog followers, visitors, subscribers, twitter followers Season's Greetings and a very happy and prosperous New Year.)
S&P 500 index chart pattern
The following remarks were made in last week's post on the daily bar chart pattern of S&P 500: "The strong index volatility during the past two months is an indication of a transition from a bull to a bear market...The impending 'death cross' of the 50 day EMA below the 200 day EMA will technically confirm a bear market."
What had appeared inevitable has happened - despite a valiant effort by bulls. The 'death cross' of the 50 day EMA below the 200 day EMA (marked by light grey ellipse) has technically confirmed that the index has fallen into a bear market.
The index had dropped below the lower Bollinger Band to an intra-day low of 2583 on Mon. Dec 10 - only to bounce up and close 5 points higher than Friday's close, forming a 'reversal day' bar (lower low, higher close).
That triggered a brief pullback rally. The index touched an intra-day high of 2685 on Wed. Dec 12, but again faced resistance from the falling 20 day SMA (blue dotted line). Bears tightened their stranglehold. The index dropped to the lower Bollinger Band on Fri. Dec 14 before bouncing up to close just below 2600 - losing 1.25% on a weekly closing basis.
Daily technical indicators are looking bearish and showing downward momentum. MACD has crossed below its signal line in bearish zone. RSI is falling below its 50% level. Slow stochastic has bounced up weakly after receiving support from the edge of its oversold zone. Expect bears to continue their 'sell on rise' strategy.
The US economy appears to be in peak shape. So, why has the index slipped into a bear market? It is quite elementary (as Sherlock Holmes would often say). The stock market rises and falls in a cyclical fashion that often 'leads' the economic cycle by several months.
On longer term weekly chart (not shown), the index closed below its sliding 20 week and 50 week EMAs, but above its 200 week EMA in a long-term bull market. Weekly technical indicators are looking bearish. MACD is falling below its signal line in bearish zone. RSI is falling after facing resistance from its 50% level. Slow stochastic is poised to fall inside its oversold zone.
FTSE 100 index chart pattern
The daily bar chart pattern of FTSE 100 had touched a 2 years low of 6674 on Thu. Dec 6. A pullback rally followed. The index touched an intra-day high of 6908 on Thu. Dec 13, but faced strong resistance from its falling 20 day EMA.
Bears sold the rise. The index slipped down below 6850 to close with a weekly gain of 1%. All three EMAs are falling. FTSE is trading below them in a bear market.
The British PM won a trust vote in Parliament but is struggling to build consensus on her BrExit deal. The uncertainty is helping bears to tighten their grip on the chart.
Daily technical indicators are looking bearish. MACD is facing resistance from its falling signal line in bearish zone. RSI failed to move above its 50% level, and has turned down. Stochastic also failed to move above its 50% level. Some more correction is likely.
On longer term weekly chart (not shown), the index bounced up a bit but closed below its three weekly EMAs in long-term bear territory. Weekly technical indicators are looking bearish and oversold. MACD is falling below its signal line. RSI has received support from the edge its oversold zone. Stochastic is trying to emerge from its oversold zone.