S&P 500 index chart pattern

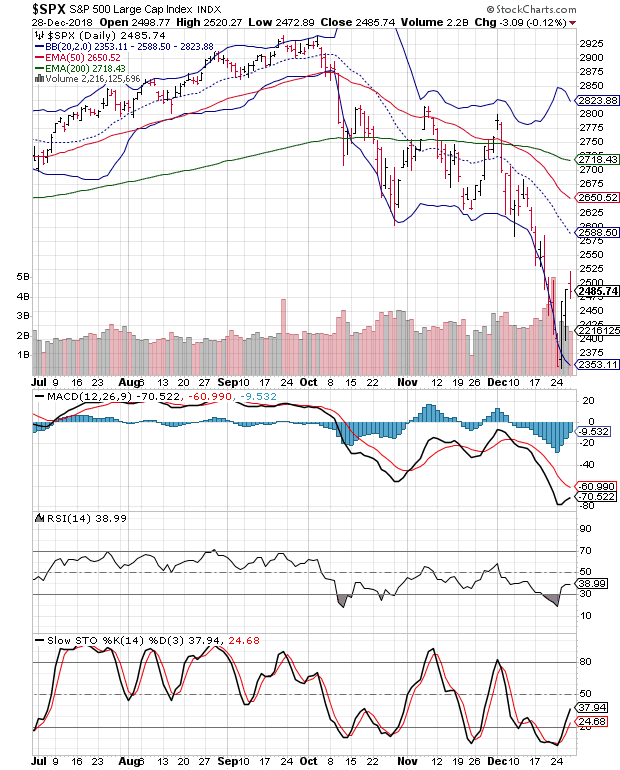
The following comments were made in last week's post on the daily bar chart pattern of S&P 500: "A spike in trading volumes is possibly an indication of a 'selling climax'. A technical bounce may follow."
After closing below the lower Bollinger Band at 2351 on Dec 24 - a 20% correction from the (Sep 21) top of 2941 that confirms a bear market - the index recovered strongly on Boxing Day.
It first touched a new low of 2347, and then recovered 121 points to close at 2468. Formation of a 'reversal day' bar (lower low, higher close) encouraged bulls to embark on a pullback rally that touched the holiday-shortened week's high of 2520 on Fri. Dec 28.
The index closed with a weekly gain of 69 points (2.9%), but formed a small 'reversal day' bar (higher high, lower close) that may bring the pullback rally to an end. The index is trading well below its 200 day EMA in a bear market.
Daily technical indicators are correcting oversold conditions. MACD is rising towards its falling signal line inside its oversold zone. RSI and Slow stochastic have emerged from their respective oversold zones. Bears are likely to use the pullback to sell.
On longer term weekly chart (not shown), the index dropped below its 200 week EMA intra-week, but bounced up to close higher, forming a 'reversal' bar. Weekly technical indicators are looking oversold. MACD is falling inside its oversold zone. RSI has bounced up from the edge of its oversold zone. Slow stochastic has turned up inside its oversold zone.
FTSE 100 index chart pattern

In a X'mas-holiday shortened trading week, the daily bar chart pattern of FTSE 100 touched a 2 years low of 6536 on Thu. Dec 27, but a pullback rally enabled a 13 points gain for the week.
The index continues to trade below its three falling EMAs in a bear market. Any attempt by bulls to progress further is likely to face more bear selling. Expect volatility to continue till the BrExit issue is settled.
Daily technical indicators are turning bullish. MACD is moving up towards its sliding signal line in bearish zone. RSI is rising towards its 50% level. Stochastic has climbed above its 50% level.
On longer term weekly chart (not shown), the index fell to a 2 years low before a sharp pullback to close above 6700. It remains well below its three weekly EMAs in long-term bear territory. Weekly technical indicators are bearish. MACD is falling inside its oversold zone. RSI is hovering near the edge of its oversold zone. Stochastic is trying to emerge from its oversold zone, hinting at some index upside.
No comments:
Post a Comment