During another holiday-shortened trading week, FIIs were net sellers of equity on Mon. and Fri. (Sep. 9 and 13), but were net buyers on Wed. and Thu. (Sep. 11 and 12). Their total net buying was worth Rs 4.6 Billion. DIIs were net sellers of equity on Thu., but were net buyers on the other three trading days. Their total net buying was worth Rs 19.0 Billion, as per provisional figures.
India's merchant exports slipped by 6.1% to US $26.13 Billion in Aug '19. Imports dropped by 13.4% to US $39.58 Billion. The trade deficit of $13.45 Billion narrowed from $17.92 Billion in Aug '18, but widened marginally from $13.43 Billion in Jul '19.
In Jul '19, India's Index of Industrial Production (IIP) rose to 4.3% from a downwardly revised 1.2% in Jun '19, but was lower than 6.5% in Jul '18. CPI-based consumer inflation in Aug '19 rose to a 10 month high of 3.2% (due to higher vegetable prices) against 3.1% in Jul '19.
BSE Sensex index chart pattern

The daily bar chart pattern of Sensex gained more than 400 points (1.1%) on a weekly closing basis as FIIs turned net buyers for the week. The index moved above its 20 day EMA, but faced resistance from its 200 day EMA.
The 50 day EMA is about 105 points above the 200 day EMA, and the two together may provide strong resistance on the upside. In case Sensex manages to move above its 50 day EMA, it can quickly reach the 38250-38500 zone. Will it?
Daily technical indicators are looking neutral to bullish. MACD rising above its signal line in bearish zone. RSI is at its neutral zone. Slow stochastic is above its 50% level. Some near-term upside is possible.
The expected third economic 'booster' package was announced by the Finance Minister on Sat. Sep 14 - some sops for exporters and affordable housing - but perhaps not enough to boost bullish sentiment. The market may have rallied in hope of a stronger 'booster' dose.
'Death cross' of the 50 day EMA below the 200 day EMA, which will technically confirm a bear market, is still awaited. Except for two or three sessions, the index has spent most of the past six weeks below its 200 day EMA in bear territory.
Small investors have kept faith in the market by not discontinuing SIPs. However, anecdotal evidence from the hinterland shows that rural economy is in shambles. The periodic 'booster' packages have not shown much effect on the ground.
NSE Nifty index chart pattern
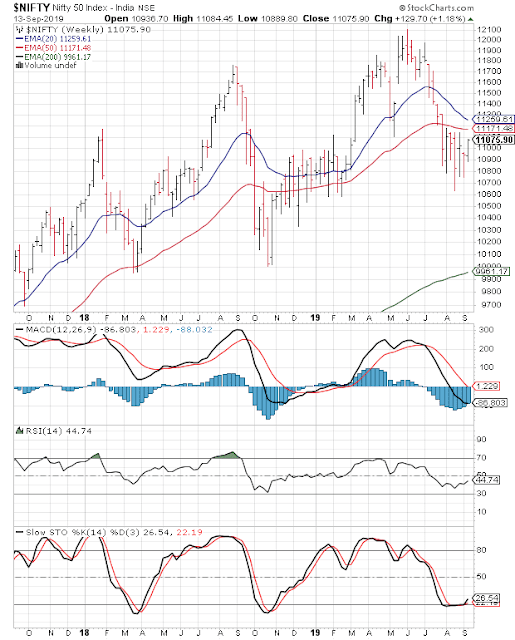
The weekly bar chart pattern of Nifty gained 130 points (1.2%) on a weekly closing basis, but closed below its 50 week EMA for the seventh straight week.
Weekly technical indicators are in bearish zones, but not showing any downward momentum. MACD is moving sideways below its falling signal line. RSI is below its 50% level. Slow stochastic has moved up a bit from the edge of its oversold zone. Expect some near-term index upside.
Nifty's TTM P/E has moved up to 27.23 - which is well above its long-term average in overbought zone. The breadth indicator NSE TRIN (not shown) is falling inside its oversold zone, and can limit near-term index upside.
Bottomline? Sensex and Nifty charts have been consolidating sideways for the past seven weeks. A low Q1 (Jun '19) GDP figure and the ongoing US-China trade spat dampened bullish sentiment. Small investors should continue with their SIPs, but avoid any impulsive buying.
No comments:
Post a Comment