S&P 500 index chart pattern
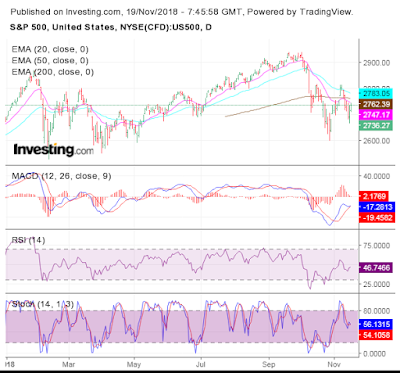
The daily bar chart pattern of S&P 500 shows how bears pounced on weakened bulls. The index dropped below its three EMAs into bear territory, and touched a low of 2671 on Thu. Nov 15 before bouncing up to close at 2736.
The index lost 1.6% on a weekly closing basis. Its repeated failures to regain bull territory may be a warning of a deeper correction. The falling 50 day EMA is only 20 points above the 200 day EMA. The 'death cross', which technically confirms a bear market, may follow soon.
Daily technical indicators are still giving conflicting signals. MACD has dropped to seek support from its rising signal line in bearish zone. RSI has fallen below its 50% level after crossing above it. Stochastic has dropped from its overbought zone and is just above its 50% level. Some more correction or consolidation is likely.
On longer term weekly chart (not shown), the index closed below its 20 week EMA but just above its 50 week EMA and well above its 200 week EMA in a long-term bull market. Weekly technical indicators have turned bearish. MACD is falling below its signal line in bullish zone, and is poised to enter bearish zone. RSI and Stochastic have dropped below their respective 50% levels.
FTSE 100 index chart pattern

The daily bar chart pattern of FTSE 100 consolidated sideways with a downward bias during the week. The index touched a low of 6969 on Fri. Nov 16, but bounced up to close at 7014 - losing 1.3% on a weekly closing basis.
All three EMAs are falling and the index is trading below them in a bear market. The British Prime Minister will try to convince business leaders today about the BrExit deal that she has worked out. (The index has risen about 25 points at the time of writing this post in anticipation of a favourable outcome.)
Daily technical indicators are looking bearish. MACD is moving sideways above its rising signal line in bearish zone. RSI is falling below its 50% level. Stochastic has dropped to the edge of its oversold zone. Some more correction or consolidation is possible.
On longer term weekly chart (not shown), the index closed well below its 20 week and 50 week EMAs and just below its 200 week EMA in long-term bear territory. Weekly technical indicators are in bearish zones. MACD is falling below its signal line. RSI is below its 50% level. Stochastic is hovering above the edge of its oversold zone.
1 comment:
The Worst Is Yet to Come for Stocks: Morgan Stanley
https://www.investopedia.com/news/worst-yet-come-stocks-morgan-stanley/
Post a Comment