Showing posts with label Suzlon. Show all posts

Friday, February 19, 2016

Why you Shouldn't Sell after a Stock Market Crash

Many small investors buy unknown 'cheap' stocks near stock market peaks. When the eventual crash comes, they are left holding their dud stocks because there are simply no buyers for these at lower prices.

Eventually, the stocks are sold off near the stock market bottom as investors try to salvage whatever they can. This phenomenon gets repeated in every bull-bear cycle.

Why does this keep happening? Because small investors get lured into the market by all the media hype during a bull phase. They expect to make quick gains without doing any homework about how the stock market functions and how to choose stocks based on fundamental and/or technical analysis.

They end up choosing stocks with weak fundamentals that appear relatively 'cheap' and are flying high due to mindless buying during later stages of a bull phase.

Is there a simple solution to the problem? Yes. Instead of buying first and then getting into trouble, seek guidance from a market veteran before buying.

It also helps to plan beforehand. That means taking stock of your present and likely future financial commitments, having the discipline to save first and spend later, and investing your monthly/quarterly savings according to an asset allocation plan.

What if you have done all that and still get caught unawares by a sudden market crash? It is very difficult not to panic when you see your hard-earned money going down the drain almost daily.

If you have done your planning properly and chosen good stocks from fundamental and technical points of view - don't sell in a panic.

A bear market is almost always followed by a bull market. Sometimes a long period of consolidation may precede the next bull phase. You have to learn to take such situations in your stride.

Your asset allocation plan will guide your decision making at every stage of a bull-bear cycle. Just have the patience and discipline to rely on it.

What if you are one of those unfortunates who bought 10000 shares of Suzlon at 25 on an impulse - only to watch the stock price drop to 13? Well, you have just learned four (rather expensive) important lessons:

  1. Never buy a junk stock - even if you do, buy 50 or 100 shares to test the waters but never in bulk
  2. Never buy on impulse - always do your due diligence before buying
  3. Always maintain a stop-loss when you buy - it will save you from a big loss
  4. You could have asked me before buying; a simple email would have saved you a lot of pain.
Here is a link to an article in investorpedia.com that gives 3 reasons for not selling after a market downturn.

Friday, July 11, 2014

Technical updates – Punj Lloyd and Suzlon

The two budget proposals during the week were met with widespread selling in the stock market. Huge expectations from the Modi-led NDA government had caused a sharp rise in stock prices – particularly of stocks from the infrastructure sector.

It turned out to be a case of ‘buy the rumour and sell the news’. The budget proposals had few populist measures and no big-bang reform proposals. Perhaps it was too much to expect from a government that has spent less than 2 months in power.

Interestingly, many stocks hit their peaks in June ‘14, well before the two budgets. The two stocks discussed below were darlings of small investors during the 2003-2007 bull market. Their tough times continue despite significant gains from recent lows.

Punj Lloyd

PunjLloyd_Jul1114

The stock of Punj Lloyd had closed at 63 back in Jan ‘13. But that was a bear market rally top. The stock soon dropped below all three EMAs. Another rally carried the stock to a lower top of 56 in May ‘13 – but the long-term support/resistance level of 57 stalled the rally.

The stock plummeted like a stone to drop to a low of 21 in end-Aug ‘13, where it formed a small double-bottom reversal pattern and started to recover. After climbing above its 20 day and 50 day EMAs, the stock entered a sideways consolidation with a slight upward bias that lasted 7 months.

All three EMAs converged in May ‘14 – and as often happens, a sharp price spurt on strong volumes followed. The stock again faced resistance from the 57 level, and has corrected down to its 50 day EMA. Technical indicators are looking bearish and oversold, which may lead to a bounce up.

The stock is technically in a bull market – but invest at your own peril. Fundamentals are atrocious.

Suzlon

Suzlon_Jul1114

The Suzlon stock has a love-hate relationship with me. I love to hate it. If you don’t know why, please read this post.

The stock spent a long period in bear territory and dropped to penny-stock status in Jun ‘13. It dropped to a low below 6 in Aug ‘13 before recovering to test its 200 day EMA in Oct ‘13.  The next 6 months were spent in a sideways consolidation in and out of penny-stock status.

A sharp rally in Apr ‘14 propelled the stock to a 2 years high of 36 in Jun ‘14 – a whopping 6-bagger gain in less than a year! All four technical indicators became overbought. The subsequent correction has dropped the stock to its 50 day EMA.

Technical indicators are looking oversold, and the stock price may bounce up from here. The company has huge losses and massive debt. Stay as far away as possible.

Tuesday, December 13, 2011

Is the Nifty stuck in the Buttered Cat paradox?

Today’s (Dec 13 ‘11) intraday movements of the Nifty index was a classic example of volatility caused by uncertainty, with alternate bouts of buying and selling making the index gyrate about its previous day’s closing level.

Neither bulls nor bears were able to make up their minds about what to do, after yesterday’s big sell-off following the announcement of the negative IIP numbers for Oct ‘11.  It reminded me of the ‘Buttered Cat paradox’ – which is a thought experiment based on two adages:

  • If you drop a cat from a height, it always falls on its feet
  • If you drop a slice of buttered toast, it always lands with the buttered side down

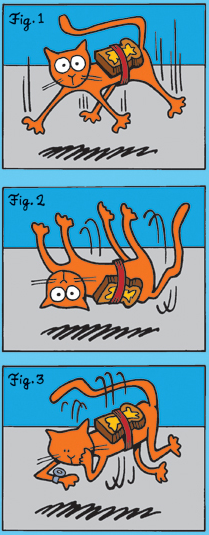
What will happen if some one straps a piece of buttered toast (with the buttered side on top) on the back of a cat and then drops the cat from a height? The toast will try to make the cat land on its back. But the cat will try to land on its feet. The end result will be a gravity-defying equilibrium where the cat will hover just above the ground level and keep whirling round and round!

Rest assured that I didn’t make this up after imbibing a few too many. It is all over the Internet. I’m even providing the wiki link from which the cartoon below was copied:

Those of you who are enamoured by the unrealised potential of alternative energy stocks like Praj (ethanol) and Suzlon (wind) can imagine the potential of harnessing emission-free green energy from hundreds and thousands of whirling buttered cats.

If you enjoy thought experiments, here is one more. Imagine a fisherman living on a small island in the middle of the Pacific Ocean very near the international date line. Every morning, he sets out on his boat and crosses the international date line (thereby gaining 24 hours). After fishing the whole day, he returns to his island by crossing the international date line once more (this time losing 24 hours). Will he ever get old?

Tuesday, May 31, 2011

How small investors can widen their Circle of Competence

Warren Buffett is a strong believer of the Circle of Competence concept. If a company or business doesn’t fall within his Circle of Competence, he won’t touch it. He famously avoided buying into any high-tech company in the 1990s – when every one and his brother-in-law were investing in dot.com companies. He didn’t understand how high-tech companies were making money, and whether they had sustainable businesses. He missed the boom – and the inevitable bust that followed.

Warren Buffett is one of a kind. You and I will never be able to match his skill and wisdom in investing. That doesn’t mean we shouldn’t follow some of his money-making principles. What if our Circle of Competence is too limited? Is there a way to widen the Circle?

Let me give you the bad news first. You can’t widen your Circle of Competence in a hurry. It is a process that will take a lot of time and effort. The good news is that the process is not difficult or complicated. It takes patience, perseverance, and a plan.

First make a short-list of all the knowledgeable people you know. The list isn’t likely to be a long one if you are looking for people with real knowledge. Not some one who knows how many hundreds Tendulkar scored before the age of 25, or the exact locations of the seven wonders of the world. But some one who knows about the economy, business and industry.

Next, figure out how you can meet such people without imposing too much on their time and patience. May be he is a friend’s father or your wife’s uncle. If you inform them in advance that you want to meet them, and the reasons for the meeting, knowledgeable people will be more than happy to share some of their experiences.

Don’t know anyone knowledgeable enough? Join discussion forums and investment groups. There are many in cyberspace. Each group or forum will have a few knowledgeable members. Try and pick their brains.

Going to a family wedding or a party? Don’t just waste your time eating and drinking and being merry. Introduce yourself to people you don’t know, and find out about what they do. If you show genuine interest in their activities, they will give you a lot of information that you won’t find in TV channels or pink papers.

Carry on this process for some time, and you will be amazed at how much wider your Circle of Competence can become. Then, have the discipline to stick to your Circle of Competence when choosing stocks to buy. That will prevent you from getting badly stuck in the shares of a company that you really know nothing about. Like Suzlon, or Punj Lloyd, or Bartronics.

Related Post

What is your Circle of Competence?

Tuesday, May 10, 2011

5 reasons why small investors should avoid stocks and buy mutual funds

Reason No. 1: Insufficient funds

Many small investors are unable to spare more than Rs 5000 or 10000 per month for investing. Such amounts are insufficient for investing in excellent stocks. Investors can at best buy only 25 shares of ITC, or 10 shares of HDFC.

Alternatively, they can buy 50 units of DSPBR Top 100 fund. The fund’s equity holdings include ITC, HDFC, TCS, Larsen & Toubro, Coal India, ONGC, ICICI Bank, Hindalco, Grasim, Bank of India, Bharti Airtel, Glaxo Pharma, Lupin, and many more stalwart stocks. 

Reason No. 2: Insufficent knowledge

Small investors have very little knowledge of how the stock market works, and what are the rules and criteria for success. They jump into the market feet first – attracted by stories of untold riches with very little effort. No wonder they end up losing big time.

Some never recover from the initial trauma, and quit the stock market for ever. Others plod along manfully, feeling happy if they can recover their losses after a few years. A handful eventually learn the ropes and end up with a decent retirement kitty.

It is much better to invest in a mutual fund, and leverage the knowledge of the fund manager.

Reason No. 3: Insufficient time

For most small investors, buying and selling stocks is a part-time activity that provides some extra money and thrills. But to become truly wealthy from one’s stock investments, one has to be engaged in it full time.

Why? Because one has to learn and monitor a variety of information – the economy, its particular cycle stage, inflation, interest rates, oil and other commodity prices, activities of FIIs and DIIs, quarterly results of individual companies, analysing annual reports, tracking promoter activities, their shareholding, and so on. Most investors have insufficient time to spare for such learning and monitoring.

The fund manager and his team get paid to do such monitoring on a daily basis. Benefit from their services.

Reason No. 4: Insufficent experience

It takes years of experience in the stock market to learn the intricacies of fundamental and technical analysis that would enable a small investor to distinguish between a good stock and an excellent stock. A good stock may give you decent returns over a couple of years and then fall from glory (think Pantaloon or Suzlon). An excellent stock – like ITC or HDFC – will provide superior returns year after year, and can be bequeathed to future generations.

Take a re-look at some of the stocks in the portfolio of DSPBR Top 100 fund (mentioned in Reason No. 1 above). That is an excellent portfolio selected by an experienced fund manager.

Reason No. 5: Insufficient risk tolerance

Almost inevitably, a stock falls in value when a small investor buys it, and rises in value when a small investor sells it. The result is usually panic, and a desperate desire to either recoup the loss or re-enter for more profits at the earliest. Without knowledge of her own risk tolerance, a small investor invariably sells too soon or buys too late.

Better leave the buying and selling of portfolio stocks to the fund manager, so you can sleep more easily at night.

Please note that a fund manager is human and can make errors in judgement. That is why it is important that you do a little research before selecting the fund you buy. Keep investing your monthly savings regularly in buying a fund through bull and bear markets. After a few years of regular investing, your investments are likely to grow considerably – and so will your experience. Then you can contemplate building a stock portfolio of your own.

Related Post:

Why building a stock portfolio is like buying a car

Thursday, April 21, 2011

Why building a stock portfolio is like buying a car

One of the requests I receive most often from blog readers and newsletter subscribers is to help them in building a ‘good’ stock portfolio. Many think that this is a trivial task. All they need is a list of ‘good’ stocks to buy. It is not that simple. A portfolio is not a ‘T’ shirt with a ‘L’ written on its label that will fit 90% of investors. It needs to be custom-tailored for a near perfect fit, to suit each individual investor’s background, experience, financial commitments, risk tolerance, and future plans.

But the real problem lies elsewhere. Most young investors can spare Rs 1 - 2 lakhs. Some have recently started earning and can only spare Rs 3000 – 5000 per month. These are insufficient amounts for building a ‘good’ stock portfolio. So, I use the analogy of buying a car.

One doesn’t go out and buy a car – specially if they have just started earning. Some prior planning is required. (Car loans are readily available nowadays, but the EMIs can burn a big hole in your pocket.) A better option may be to buy a scooter or motor cycle for immediate transportation needs. Even then, you need to learn the rules of the road, and get a driver’s licence before you buy anything.

Unfortunately, there is no licence required to invest in the stock market. Most small investors jump into the market without any knowledge of the basic rules of investing. No wonder their stocks crash and they suffer heavy injuries (to their savings). Grow your capital by regularly investing in fixed deposits, recurring deposits, PO MIS, ETFs, mutual fund units till you have sufficient capital to buy a ‘good’ car.

Can’t you buy Rs 3000 – 5000 worth of stocks every month? Yes, but which stocks? You can’t even buy 10 shares of Tata Steel. So you’ll probably buy 100 shares of Suzlon instead, or worse still, 800 shares of Cranes Software! Your risk of loss will increase proportionately. You are far better off investing that amount of money every month in a ‘good’ fund like DSPBR Top 100 or HDFC Prudence. After 5 or 6 years of regular savings, you may have sufficient capital for a ‘good’ portfolio.

How much is sufficient capital? I suggest Rs 5 lakhs as a bare minimum. Rs 10 lakhs is a more reasonable figure. Can’t cars be bought for Rs 1 - 2 lakhs? Yes, they can. But they won’t be ‘good’ cars. How about a used car? That may work, but is likely to require regular trips to the service centre for repairs. And you really can’t be sure if a used car is really a ‘good’ car. The previous owner may not have driven or maintained it properly.

Even with Rs 5 lakhs, you will only be able to buy a decent entry-level car. But if you are ready to spend Rs 10 lakhs, then your choice of ‘good’ cars increases significantly. And if you own a Rs 10 lakh car, chances are that you will take good care of it by following scheduled maintenance procedures, getting repairs done promptly, adding accessories that will enhance your driving comfort and experience.

A ‘good’ stock portfolio needs sufficient capital, and has to be nurtured and maintained as well – by keeping track of market happenings, individual stock results, using opportunities to book part profits or add more on dips. The emphasis should be on safety, and not about driving/investing recklessly.

Thursday, March 24, 2011

How to read the Cash Flow Statement – Part 2

In last Tuesday’s post, I had covered the first part of the Cash Flow Statement – Cash Flow from Operating Activities. The next two parts will be discussed in this post.

Part 2: Cash Flow from Investing Activities 

To remain in business over the long haul, a company needs to grow. Without growth, a business will stagnate and eventually die or get acquired. But growth has a price. Cash has to be spent to buy land, machinery and related equipment, build factories and offices, acquire other companies, start subsidiaries or joint ventures, and make appropriate investments.

All of the above comes under Cash Flow from Investing Activities. You don’t have to be a genius to guess that this figure will be a (negative) one for most companies. Many mature companies, particularly those in the FMCG sector, don’t have much need for Capital Expenditure (i.e. spending cash on factories and equipment) because their rate of growth has slowed down.

Ideally, the depreciation amount in the Profit and Loss statement should be less than or equal to the amount of cash being spent in investing activities – because depreciation is meant to cover the notional loss due to wear and tear of the existing plant and machinery. If a company does not continuously spend on upgrading and modernising its facilities, it will not be able to compete with newer entrants who may have the latest technology and equipment.

The definition of Free Cash Flow is:

Cash Flow from Operating Activities – Capital Expenditure

This is a (negative) number for companies in their early growth stage, when cash generated from core operations may be insufficient to cover the cost of capital expenditure. But for well-established companies, positive Free Cash Flow is an indication of financial health. The more positive Free Cash Flow a company can generate, the easier it is for them to expand, acquire, pay dividend or buy back shares, and pay off loans.

Part 3: Cash Flow from Financing Activities 

What if a company has (negative) Free Cash Flow, or still worse, has (negative) Cash Flow from Operating Activities? Where will they get the cash to pay their suppliers, interest to banks for any loans taken, and for growing the business?

They can either resort to more borrowings, and/or issue more shares. If such companies are showing a net profit, then they are also expected to pay dividends to their shareholders. All inflows and outflows of cash due to loans, share issues, share buybacks, dividend payments come within Cash Flow from Financing Activities.

Financial prudence should dictate a company’s growth plans. As a thumb rule for selecting good stocks, about 60-70% of the Cash Flow from Investing Activities (Part 2) should be funded by positive Cash Flow from Operating Activities (Part 1); the balance 30-40% should come from Cash Flow from Financing Activities (Part 3).

Many companies forget the simple adage that one should cut one’s coat according to the cloth. They may even have positive Cash Flow from Operating Activities, but their ambitious growth plans require far more cash than they can afford. They resort to frequent borrowings and share issues in the hope of reaching the top quickly. One or two bad years can bring such companies down to their knees. Pantaloon and Suzlon come to mind.

(Note: The financial health of banks and financial institutions can’t be judged by analysing the Cash Flow Statement alone – because they need to borrow cash to give loans, and invariably have negative Cash Flow from Operating Activities. Price to Book Value and Return on Assets are better measures for such companies.)

Related Post

What is the Return on Assets (RoA) ratio?

Tuesday, January 4, 2011

Why do retail investors fall prey to the ‘get rich quick’ syndrome?

Most retail investors enter the stock market for the first time near a peak, after hearing about their friends or relatives who became rich overnight by investing in stocks. They think – like many poor souls before them – that getting rich quickly from the stock market is the best idea since sliced bread.

In a country with a large number of educated youth and inadequate employment opportunities, there are enough con-men and charlatans trying to make a quick buck by promising jobs. They usually lure unemployed youth with guaranteed jobs – even overseas jobs - if they can first cough up a sufficiently large amount of money.

One can appreciate and understand why an unemployed person may get tricked by such scams. He has a genuine need of money to sustain himself and his family. But it is really shocking that young people who are not just well-educated but also well-employed falling prey to the ‘get rich quick’ syndrome.

After announcing the re-opening of subscriptions to my Monthly Investment Newsletter in a recent post, I received an email that went something like this:

‘I lost a large sum trading intra-day. I went long in Nifty futures. The spate of scams made the market tank. Booked heavy loss. Then went short in Nifty futures, but the market moved up. Again booked heavy loss. Now my only hope is your investment calls will not only help me to recover my losses but make some profit also.’

I was at a loss as well – for words. He was expecting more than a 150% gain to cover his losses and make some profit. Why did he get into this mess in the first place? He thought making money in the stock market was a piece of cake. In other words, he had fallen prey to the ‘get rich quick’ syndrome.

Any long-term investor will say with confidence that if one buys good blue chip stocks at reasonable prices and holds on for 3 to 5 years, one can easily make 15-20% per annum returns on investment. Those returns adequately cover the risk-free bank interest and the prevailing rate of inflation.

But one should not expect higher returns over the long-term. Higher returns may happen in a particular year. Not over several years. Rome wasn’t built in a day. A portfolio of strong stocks that provide steady returns year after year also takes time and patience to build.

Unfortunately, today’s generation prefers instant noodles, 20-20 cricket, and paying by plastic cards. ‘Patience’, ‘discipline’ and ‘long-term’ are replaced by ‘I want it now’ in the dictionary. No wonder young investors find Tata Steel and Colgate boring, and run after Suzlon and Bartronics in the hope of getting rich quick.

Thursday, September 9, 2010

Can a growing, profitable company go out of business?

Yes, even a growing, profitable company can go out of business. Most small enterprises fail because of various reasons like - a poor business model, lack of distribution skills, inadequate market research, improper SWOT analysis. But the majority fail because of one simple reason. They run out of cash.

My favourite niece, a student of economics, came to me during her summer break to help her plan a small enterprise. She is very good at preparing cakes and pastries, and wanted to supply them to the myriad sweet-meat shops within a 3 KM radius from her home.

I told her to visit some of the more popular shops with her samples and find out whether they would be interested in stocking and selling her products, and what kind of terms they would offer. After about 10 days or so, she came with a beaming smile and a print-out of a spreadsheet.

“Uncle, we have a winner on our hands. You just need to fund my first month’s expenses. From the second month onwards, the venture will be in profits!” Without pouring cold water on her enthusiasm immediately, I decided to look at her figures. Here they are:


Month 1

Month 2

Month 3

Sales

6000

9000

13500

Raw Materials

3600

5400

8100

Gross Profit

2400

3600

5400

Expenses

3000

3000

3000

Net Profit

(600)

600

2400

“Looks pretty good. What kind of terms did you get from the grocer and the shops?” I asked. Being a smart kid, she had an answer ready. The grocer had extended a 30 days credit for the raw materials. The sweet-meat shops wanted 60 days credit from her.

“What are the expenses for?”, was my next question. She wanted to hire a person to help her in the kitchen, and to deliver the pastries and cakes to the shops and collect payment. The expenses included the cost of transportation.

“OK. But you do realise that you are not going to get paid for your efforts for two months? Have you figured out your actual cash requirements?” This time, she wasn’t prepared with an answer.

So, I started to explain patiently. In Month 1, the ‘Sales’ are on credit. The entire 6000 won’t be received. The ‘Raw Materials’ also won’t be paid for, and will remain due. But the expenses of 3000 need to be paid.

In Month 2, the ‘Sales’ are again on credit. No cash is received. The month’s ‘Raw Materials’ are not paid for, but the earlier month’s ‘Raw Materials’ worth 3600, plus the expenses of 3000 – a total of 6600 has to be paid out.

In Month 3, finally some cash comes in, the first month’s ‘Sales’ of 6000. But that isn’t enough to cover Month 2’s ‘Raw Materials’ of 5400, plus the expenses of 3000. A net amount of 2400 (= 8400 – 6000) has to be paid out.

From the Net Profit figures in the table above, the aggregate profits after Month 3 is 2400 (= –600 + 600 + 2400). An enterprise growing at 50% and making profits. But these profits are not ‘real’, just an accounting sleight of hand.

Actually, the cash paid out will be 12000 (= 3000 + 6600 + 2400). That is the only ‘real’ thing that will happen after all the activities of baking and delivering cakes and pastries for 3 months!

What would happen if some of the shops defer their payments? More cash would be required to cover the shortfall. What if my niece decides that such a growing and profitable business should be quickly expanded to other parts of the city? That would require additional expenses, multiplying the cash requirements.

This is a simplified example of a small enterprise, based on an imaginary conversation with my fictional niece. Now, change the ‘Month’ to ‘Year’ in the above table, and the figures to Rs Crores. Next, add a column for Year 4, where the sales drop by 50% while the ‘Raw Materials’ are already in inventory and ‘Expenses’ stay the same. What do you get? Suzlon Energy!

The point is: profits do not mean cash. Profits are more often than not fudged by company management and pliable auditors. It is much more difficult to fudge the cash flow statement – because it shows up in the ‘Cash and Bank balances’ of the Balance Sheet.

This is one of the main reasons that investors should check out the Cash Flow statement in an Annual Report before looking at the Balance Sheet and Profit and Loss statements. Needless to say, such due diligence should be done before buying a single share.

(Note: A friend who works as an accountant at a telecom services company, was late for a get-together last Saturday. “Were you working overtime with month-end closing figures?”, I asked. “No, no”, was his response. “We have kept August sales open till the 7th of Sept!” This kind of fudging is standard practice in many organisations.)

Thursday, September 2, 2010

Is it a good strategy to ‘average down’ when the price of a stock starts to fall?

The short answer is ‘NO’. Many small investors lose money by trying to ‘average down’ when the price of a stock, which they bought at higher levels, start to fall. How do I know? By the emails I receive from readers and the questions I hear on business TV channels.

Here is a recent email:’I bought Bartronics at an average price of 138. Now it is falling. What should I do?’ Reading between the lines, one can guess that the investor bought at a higher level than 138 and bought more as the price fell, to ‘average down’.

I wrote two posts on Bartronics – first in Jun ‘09 when the stock closed at 165 and the second in Mar ‘10 when the stock closed at 150. On both occasions, investors were advised to get out before it was too late, because the fundamentals of the company were poor. So, I referred the investor to my earlier posts.

The response was: ‘Thanks, I’ll sell Bartronics tomorrow at whatever price I can get, and reinvest in Punj Lloyd or Suzlon.’ I wrote back immediately that both those stocks should be avoided like the plague!

Why? Instead of providing 1000 words of explanation, I’ll take recourse to some pictures:

Downtrend_Bartronics_Sep0110

The Bartronics stock tried a brief recovery above the 200 day EMA on decent volumes in Jul ‘10 – setting up a perfect bull trap. The subsequent waterfall-like drop has taken the index well below the 200 day and 50 day EMAs on increasing volumes.

Downtrend_PunjL_Sep0110

The Punj Lloyd stock went briefly above the 200 day EMA back in Jan ‘10, and has since been in a steady decline well below the 200 day EMA – making lower tops and bottoms. Volumes have been higher on down days. Signs of stocks going from stronger to weaker hands.

Downtrend_Suzlon_Sep0110

The Suzlon stock also went above the 200 day EMA in Jan ‘10, and has since fallen continuously – well below the 200 day EMA. Even if you are enamoured by wind energy, stay away from this bag of wind.

Note that while the Sensex has been making new highs for the past year in a bull market, all three stocks are in bear markets, with no end to their bottoms in sight. ‘Averaging down’ on such stocks can only lead to increasing your losses.

As a contrast, here are some other pictures:

Uptrend_Akzo_Sep0110

After a long sideways consolidation, the Akzo Nobel (former ICI India) stock has had a huge upward break out.

Uptrend_ASAL_Sep0110

Automotive Stampings is a small-cap auto ancilliary from the house of Tatas that was rising steadily before a sharp break out on strong volumes.

Uptrend_TataMotors_Sep0110

After making a loss and languishing due to the debt burden of the Jaguar-Land Rover acquisition, the Tata Motors stock has comfortably out-performed the Sensex over the past year.

I am not suggesting that you buy these stocks right away. It is better to be cautious when a stock is near a 52 week high. But here are a couple of thumb rules that can be easily followed by novice investors:

1. When a stock is moving up above a rising 200 day EMA, it is in a bull market. The strategy should be to buy the dips. That means ‘averaging up’. Use a trailing stop-loss to protect your profits.

2. When a stock is moving down below a falling 200 day EMA, it is in a bear market. You don’t make money in a bear market by buying, but by selling. The strategy should be to sell on every rise.

If you can buy the shares back at the next bottom and sell on the following rise, you can make a ton of money. But such a strategy – known as ‘short-selling’  - is not advised for inexperienced investors.

Related Post

Some do's and don'ts about Cost Averaging

Tuesday, July 21, 2009

What exactly is the Margin of Safety?

The heading of Chapter 20 of Benjamin Graham's 'The Intelligent Investor' (4th edition) reads: "Margin of Safety" as the Central Concept of Investment.

What is the Margin of Safety as applicable to stock investments? It is the amount by which a stock's price is lower than the intrinsic, or underlying, value of the stock.

There are several methods by which one can arrive at the intrinsic value of a company's stock - and I plan to write a post about it in future. Suffice it to say that none of these methods can give an exact value. At best it will be a reasonably close approximation.

Here is a definition from the master:

'Over a ten-year period the typical excess of stock earning power over bond interest may aggregate 50% of the price paid. The figure is sufficient to provide a very real margin of safety - which, under favorable conditions, will prevent or minimize a loss. If such a margin is present in each of a diversified list of twenty or more stocks, the probability of a favorable result under "fairly normal conditions" becomes very large.'

Some terms may require a bit more explanation. By 'bond interest', Graham means yield from strong corporate bonds. Since the bond market in India is underdeveloped, we will use Fixed Deposit(FD) interest in a public sector bank as an equivalent guideline. 'Stock earning power' is the same as earnings yield, which is the inverse of the P/E ratio.

Enough talk. Time for some concrete examples.

(a) Company XYZ has declared its results and has an EPS (i.e. earnings per share, calculated by dividing the net profit by the number of equity shares) of 10. The recent market rally has taken the stock's price to 150. That gives a P/E ratio of 15.

The earnings yield is E/P= 1/15= 6.7%. This is lower than the current FD interest rate of 8%. The Margin of Safety is a negative 1.3% (=6.7-8). What does it mean? The current yield from the stock is less than that from a risk free FD.

(b) Company PQR also has an EPS of 10. But its price hasn't moved up as much as XYZ, and is currently trading at 100. The P/E is 10 and the earnings yield= E/P= 10%. The Margin of Safety is 2%. That gives an excess of only 20% over the FD interest, which doesn't meet Graham's criterion of 50% excess over a 10 year period.

(c) Company ABC has a lower EPS of 9, and its price is also lower at 63. The P/E is 7; earnings yield= E/P= 14%; Margin of Safety is 6%. This meets Graham's criteria, because the excess of stock earning power over FD yield is 60% over 10 years. The greater risk of owning the stock is adequately covered by the margin of safety.

Does it mean that you rush out to buy Company ABC? Not yet. You still have to perform a detailed fundamental analysis using Graham's criteria mentioned in my earlier blog post about stock picking (link given below).

These examples have been simplified by excluding the effects of inflation and any tax incidence. But the 'Central Concept of Investment' is de-risking your portfolio by maintaining adequate margin of safety for each stock that you select.

Even by using the Margin of Safety method, you may pick a stock or two that go down. That is why Graham has mentioned owning about 20 stocks, so that in aggregate, the portfolio will gain over the long term.

Graham passed away in 1976. How relevant are these figures and methods in today's environment? Apparently, they work just as well, as John Reese has mentioned in his book, The Guru Investor.

Individual investors can tweak the figures to suit their investment style and risk tolerance. Remember that it is just as important to protect the downside of your portfolio while you try to build long term wealth through stock investments.

For those readers, who are beginning to get a little tired of my exhortations towards the slow but steady value investing concept of wealth building, I have some good news.

By keeping a higher margin of safety, even fundamentally weak stocks can be bought when they sink to abysmal depths during bear markets. Just look at the prices of Satyam, Suzlon, Unitech when they hit their recent bottoms, and compare with current prices. But that would be succumbing to the 'greater fool' theory!

Related posts

How to pick Stocks for Investment - Part III
How to build wealth using a buy and hold strategy

Thursday, June 18, 2009

Stock Chart Pattern - Sanghvi Movers

The stock chart pattern of Sanghvi Movers has a couple of interesting formations - one is very positive, and the other - which is still forming - is quite negative.

Before delving in to the details, a small confession. I have very little information about the management quality. But they seem to be on to a good thing. What is Sanghvi Movers' business? They hire out cranes for construction projects.

What is the big deal about that? It is just the kind of business the big boys will not get into. That has allowed this small-cap company (equity less than Rs 10 Crores) to become the largest crane hiring company in India, and the 3rd largest in Asia.

Sanghvi Movers' client list reads like a 'who's who' of the engineering and construction industry. They have close relationships with Reliance, BHEL and Suzlon. Robust cash flows from operations, growing earnings and dividends, more than 300 medium and large size cranes amongst its assets - all add up to a company whose future is tied to India's growth story.

The 1 year bar chart pattern of Sanghvi Movers shows that savvy investors have already caught on to the stock:-

Sanghvi Movers_June1809

After making an almost perfect bullish 'rounding bottom' formation with a low of Rs 60 made on Mar 4, '09, the stock moved up quickly and hit a high of Rs 199 yesterday.

Take a look at the pattern forming since the middle of May '09. If you draw a line connecting the tops, you will see a semi-circle being formed. Such a 'rounding top', if formed, is a bearish pattern that could lead to a sharp decline.

The RSI has been moving down as the stock has moved sideways for most of this month. The slow stochastic has moved down from the overbought zone and the %K line is below the %D line. The MACD is in positive territory but has gone below its signal line. All three indicators are showing negative divergences.

The OBV is the only indicator that looks bullish. But look a little closer. A sharp volume spike on Jun 2, '09 (a bulk deal?) moved the OBV into positive territory. Otherwise it was meandering below the '0' line, with a marginal rise during April and May '09. In fact, the pick up in volumes happened only during the past month.

Please note that Sanghvi Movers is a Rs 2 face-value stock, so the current price of Rs 177 is equivalent to Rs 885 for a Rs 10 face-value stock. Are there any other negatives? Yes, the huge debt. Obviously, the nature of the business is such that to keep up with the growth, the company needs to invest continuously in capital equipment.

Bottomline? On a correction, the stock chart pattern of Sanghvi Movers can move down to the Rs 120-130 levels and seek support from its 50 day EMA. Entry can be considered on the dip by intrepid investors for a 100% gain within a year or so.

Wednesday, May 13, 2009

Stock chart pattern discussions - hits and misses

In my individual stock chart pattern discussions on Wednesdays, 10 stocks have been covered so far. It may be worthwhile to do a reality check to find out what I had observed and inferred and how the chart patterns actually shaped up.

1.  ICI India - ICI had pierced and closed above its 200 day EMA before dropping below, and was consolidating between the 50 day and 200 day EMAs around the Rs 416 level. I had suggested: Good stock to accumulate in small quantities for conservative, long term investors.

ICI_May1109

The stock has slowly but steadily moved up well above its 200 day EMA and added about 15%. Nothing great, but can be counted as a 'hit'.

2.  Suzlon Energy - The stock was looking oversold. There was a possibility of a bounce up, but it could also go lower. My advice: Investors should not go anywhere near this stock. Adventurous traders may want to make a punt with very tight stop losses.

Suzlon_May1109

After going marginally lower, the stock moved up rapidly with the global rally and jumped up by almost 150%! It is still well below its 200 day EMA in spite of the sharp rise. A 'miss'.

3.  State Bank - SBI was looking like a value buy as it was trading at its book value. I observed the strong support at 900, but did not expect an up move to go beyond 1100.

SBI_May1209

SBI moved up 40% with the global rally before facing resistance at a previous top of 1400. Another 'miss'.

4.  Unitech - The stock was being accumulated near its 52 week bottom and I expected a move upwards. But advised: Unless the strong resistance between 50-60 levels is overcome, there is no point in entering Unitech.

Unitech_May1209

The stock did move up to the resistance zone of 50-60, but despite two attempts, was unable to cross it. A 'hit'.

5.  Hero Honda - This was one of the few stocks in a bull phase but at 1100 level was looking overbought and due for a correction. My suggestion: New investors may buy on dips. Existing investors should hang on tight and enjoy the ride.

HeroHonda_May1209

After correcting to Rs 1000, the stock has steadily moved up to Rs 1200 and continues in its bull phase with all three averages moving up.

6.  Reliance Capital - I had expected the stock to face some resistance at 490-500 before moving up to 625 level, and had advised short and long term investors to get in at the next dip.

RelCap_May1209

Reliance Capital sailed upwards to 580, reacted to 490 and then moved up to 625, where it faced resistance. I will count that as a 'hit', though the short term gain was only about 30%.

7.  Infosys - Despite a sell-off due to disappointing results that dropped the stock below its 200 day EMA, I had observed a 'rounding bottom' bullish pattern and advised: Wait for the selling pressure to subside before entering the stock on the dip. Be prepared for a longish wait for profits.

Infosys_May1209

The stock smoothly moved up from Rs 1300 to Rs 1600, well above its 200 day EMA. Another 'hit'.

8.  DLF -  A 'rounding bottom' bullish pattern was observed but the failure to cross the resistance level of Rs 300 led me to suggest: If you haven't got rid of your DLF holding yet, you may get one more chance to do so. There is a possibility that this rally is taking a pause before trying to move higher again.

DLF_May1209

The stock moved down to Rs 220 before moving up to Rs 269 to provide one more chance for investors to get out. A 'hit'.

9.  Bharti Airtel - The upward rally looked too steep. The lower volumes remain a concern. The 20 day EMA did move up above the 200 day EMA as expected. My advice: An existing holder can keep riding the rally or book partial profits.

Bharti_May1209

The stock has continued its upward move with a slight dip for 2 days. A 'hit'.

10. Balrampur Chini - The 50 day EMA did move above the 200 day EMA but instead of a correction, the stock is undergoing a triangular consolidation before the next up move. My suggestion: I would wait till the election results come out before entering.

Balrampur_May1209

It has been only five trading sessions since my discussion - too early to draw conclusions. A 'neutral'.

Without trying to be immodest, not a bad performance at all. Comments are welcome.

(Note: Please right-click on the charts and open them in a new tab or window for a better view.)

Wednesday, March 11, 2009

Stock Chart Pattern - Suzlon Energy Ltd

Today is the second of my stock chart pattern discussions. Last week I had shown the chart pattern of ICI India Ltd.  This week I have chosen the stock chart pattern of a stock I love to hate.

Before delving into the Suzlon chart, let me digress a bit and introduce a small part of a nonsense rhyme written by Sukumar Ray (father of well-known filmmaker, Satyajit Ray). Loosely translated from the original Bengali, it reads something like this:

Once there was a porcupine - in grammar it just could not shine

Turned into a 'duck-upine';  how? I can not determine!

Sukumar Ray, like his son Satyajit Ray, was an illustrator of repute and the above rhyme in the book 'Abol Tabol' (which means complete nonsense) had an illustration of a 'duck-upine' - the front part looked like a duck and the rear like a porcupine.

There have been several 'duck-upine's in the history of Indian industry - the most well-known recent example being Tulsi Tanti. From a relatively unknown background in cold storage, construction, textiles and several other businesses - none of which made him much money - he defied grammar to suddenly turn into a wind energy king, and the fourth richest Indian.

Please don't get me wrong. I have nothing against energetic entrepreneurs trying their luck in different fields. My gripe is against entrepreneurs who adopt dubious means - like reportedly laundering underworld money through an IPO, allegedly creating fictitious projects to avail tax breaks, supplying substandard materials, and technology bought from a loss-making bankrupt company, for export orders.

While no wrongdoing has been proven against Suzlon so far, there has been investigations by authorities and payment of penalty for substandard supplies. As the old saying goes: where there is smoke, there is fire.

Let us take a look at Suzlon's 1 year chart pattern:

 Suzlon_Mar0909

(You can right-click on the image above and open it in a new tab or window for a better view.)

After holding on to Rs 250 level till the middle of Sept '08, the stock fell off a cliff to make new 52 week lows in Oct and Dec '08 and then entered a sideways consolidation pattern.

The volumes - overlaid on the price chart - increased significantly during Nov and Dec '08 before starting to taper off from Jan '09. The stock is at a new 52 week closing low of around Rs 34. (Please note that Suzlon is now a Rs 2 face value stock.)

The 20 day EMA is below the 50 day EMA, which in turn is below the 200 day EMA, and all three moving averages are heading down. That means no end in sight for the bear mauling. (If you are not aware of the significance of EMAs, please read the post:

"Why you need to follow the latest trends to become a better investor")

The gap between the 50 day EMA and 200 day EMA is large and increasing. The slow stochastics and RSI are below the '20' line. These indicate that the stock is oversold. MACD and ROC are hovering near the '0' line, indicating indecision.

The spurt in volumes in Nov and Dec '08 - usually caused by accumulation - pulled the stock up to the Rs 70 levels twice. Both occasions were used by smart investors to sell out. Small investors, sensing a 'bargain' and trying to average their earlier higher cost purchases, are now well and truly stuck.

Though the stock is looking oversold, and can make a small bounce up, the fact that it is making new lows on receding volumes indicates that it can go lower.

Bottomline? Investors should not go anywhere near this stock. Adventurous traders may want to make a punt with very tight stop losses.

Friday, February 27, 2009

Stock Market News, Financial News - Feb 27, 2009

ANALYSIS - Insurers, drug makers take hit under Obama plan

By Susan Heavey

WASHINGTON (Reuters) - U.S. President Barack Obama's 2010 budget proposal takes direct aim at drug makers and health insurers to help fund an overhaul of the U.S. healthcare system.

His plan, outlined Thursday, calls for lowering Medicare payments to private insurers, allowing consumers to buy cheaper medicines from overseas and preventing drug companies from making deals that block generic competition.

Shares of U.S. health insurers suffered, with Humana Inc down 19 percent, Aetna Inc off 11 percent, Cigna Corp down 7 percent, UnitedHealth Group Inc off 12 percent and WellPoint Inc down 9 percent in afternoon trading.  (More ... )

----------------------------------------------------------------------------------

GLOBAL MARKETS - Asian shares flat in end to tough month

By Rafael Nam

HONG KONG (Reuters) - Asian shares were flat on Friday, ending the month with losses on continued investor concern over the world economy and the financial system, while safety bids such as dollar buying erased some of their recent gains.

The advances in stock markets at the start of the year unraveled further in February as the MSCI index of Asian shares outside Japan headed for a 5 percent monthly fall, having hit at one point their lowest since the five-year lows in late November.

Risk aversion in February was reflected in the surge of the dollar, which is on track to its biggest monthly gain against the yen since 1995, and a rally in gold that took it past the $1,000 an ounce barrier to approach a March 2008 record.  (More ... )

-----------------------------------------------------------------------------------

ASEAN sends mixed signals on trade, rights

By Nopporn Wong-Anan

HUA HIN, Thailand (Reuters) - Southeast Asian foreign and trade ministers met in Thailand on Friday to start on the road to turning the 41-year old ASEAN grouping into an EU-style common market by 2015 and keeping their economies on a growth trajectory.

But leaders of the Association of South East Asian Nations sent mixed signals about free trade in the midst of the worst global financial crisis in decades as they gathered for an annual summit at Thailand's royal seaside resort of Hua Hin.  (More ... )

-----------------------------------------------------------------------------------

Suzlon: U.S. wind growth slowing in '09

By Matt Daily

NEW YORK (Reuters) - Sales of new U.S. wind power generation in 2009 will probably be half the record 2008 level as the financial crisis paralyzed cash flows to new wind farms, the head of wind turbine maker Suzlon Energy Ltd's U.S. operations said on Thursday.

That contraction will reduce revenues for Suzlon in the world's largest wind power market from the nearly $1 billion the company posted in 2008, Andris Cukurs, chief executive of the Suzlon U.S. operations, said in an interview.

Development of new wind farms has slowed sharply in recent months as banks suffering from the global credit crisis shut off the flow of money for new projects.  (More ... )

-----------------------------------------------------------------------------------

Indian exports to contract through March quarter

By Manoj Kumar and Rajesh Kumar Singh

NEW DELHI (Reuters) - India's exports in January contracted a sharp 16 percent and are expected to fall for the next two months, a senior official said, as a deepening global slump slashes away at demand for its goods and services.

Exports, which make up close a fifth of Asia's third-largest economy, will have fallen for four months in a row if the estimates of the Director General of Foreign Trade, R.S. Gujral, prove to be correct, after years of speedy growth.  (More ... )