Showing posts with label whipsaw. Show all posts

Sunday, June 18, 2017

Sensex, Nifty charts (Jun 16, 2017): bears stop charging bulls

FIIs were net sellers of equity worth a huge Rs 20.5 Billion for the week. DIIs more than matched them with their net buying of equity worth Rs 20.6 Billion, as per provisional figures.

Both Sensex and Nifty closed lower for the week - Sensex by about 0.7% and Nifty by 0.8%.

The NDA government has initiated two long awaited banking sector reforms. 12 corporate entities with huge outstanding debts from PSU banks are being wound up. Several smaller PSU banks are going to get merged with larger PSU banks.

BSE Sensex index chart pattern

The following comments appeared in last week's post on the daily bar chart pattern of Sensex: "It is important that the index receives support from 'fan line 3' if the correction continues. In case 'fan line 3' is breached, a deeper correction towards 30000 may ensue."

On Fri.Jun 16, the index closed just below 'fan line 3'. Technically, it is not a convincing breach because of the 3% 'whipsaw' rule. Also, the index is receiving good support from its 20 day EMA, and can bounce up from here.

Note what happened back on Mar 8, when 'fan line 1' was initially breached. The index recovered and moved back above 'fan line 1', but subsequently breached 'fan line 1' more convincingly on Mar 21.

Any breach of a trend line - even if unconvincing at first - should be treated with caution. It is a warning about things to come. In other words, don't jump in to buy the dip just yet.

Daily technical indicators are looking bearish and hinting at some more correction. MACD is sliding down below its signal line in bullish zone. ROC, RSI and Slow stochastic have dropped inside their respective bearish zones, and showing downward momentum.

Sensex continues to trade above its three EMAs in a bull market. Stay invested. Let the correction play out.

NSE Nifty index chart pattern

The weekly bar chart pattern of Nifty broke its 7 week stretch of touching higher tops. Last week's 'doji' candlestick pattern may have marked an intermediate top.

The index is trading well above its two rising weekly EMAs in a bull market. Some more correction will improve the technical 'health' of the chart.

Weekly technical indicators are inside their respective overbought zones, but showing downward momentum.

Nifty's TTM P/E is at 24 - lower than last week but much higher than its long-term average. The breadth indicator NSE TRIN (not shown) has bounced up a bit after dropping sharply into its overbought zone.

The correction may continue a bit longer - specially with FIIs in sell mode.

Bottomline? Sensex and Nifty charts have started to correct after touching new highs in the previous week. The corrections will enable the indices to gather strength to climb to new highs. Stay invested. Wait for the correction to play out before buying.

Monday, May 22, 2017

S&P 500 and FTSE 100 charts (May 19 '17): bears down but yet to be counted out

S&P 500 index chart pattern


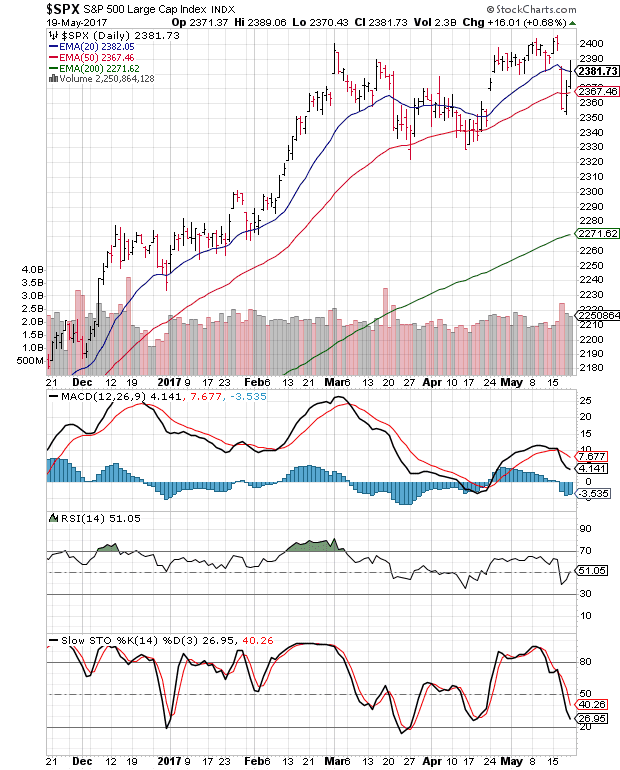
Negative divergences visible on technical indicators had led to the following comment in last week's post on the daily bar chart pattern of S&P 500: "Some more correction or consolidation is likely before a convincing break out above 2400 can occur." 

On Mon. May 15, the index closed at 2402 - but it wasn't a convincing close above 2400 because of the '3% whipsaw rule.' The next day, the index touched a new intra-day high of 2405 only to close slightly lower than Monday's closing level - forming a 'reversal day' bar.

That was just the trigger bears needed to jump into action. The index opened trading with a downward 'gap' below its 20 day EMA on Wed. May 17, and fell sharply below its 50 day EMA with huge volumes to close at its lowest level in 4 weeks.

On Thu. May 18, the index dropped a little lower (to 2353) but closed higher - forming another 'reversal day' bar with good volume support - completely filling the upward 'gap' formed on Apr 24. That encouraged bulls to fight back. 

The index closed the week above its 50 day EMA but just below its sliding 20 day EMA - partly filling Wednesday's downward 'gap' and losing 9 points for the week.

Daily technical indicators are looking bearish. MACD is falling below its signal line in bullish zone. RSI dropped below its 50% level but has moved up to neutral zone. Slow stochastic is falling below its 50% level towards its oversold zone.

Bears have successfully defended the 2400 level for almost 3 months. However, the next bull charge may overwhelm them. Expect some more consolidation till then.

On longer term weekly chart (not shown), the index formed a weekly 'reversal bar' (higher high, lower close) but closed well above its three rising weekly EMAs in a long-term bull market. Weekly technical indicators are correcting overbought conditions.

FTSE 100 index chart pattern


In last week's post on the daily bar chart pattern of FTSE 100, the following likely index movements were mentioned:

- a test of the Mar 17 top of 7447
- a pullback towards 7400
- a convincing move above 7450 that could put bulls back on the driver's seat

On Mon. May 15, the index easily crossed above 7447 and closed at 7454. The next day, the index soared to a new high of 7534 with strong volume support, and closed at 7522. 

On Wed. May 17, the index touched a slightly lower top of 7533 - forming a small 'double top' reversal pattern that brought bears back into action. On Thu. May 18, the index dropped below 7400 to touch an intra-day low of 7389 with strong volumes.

Bulls fought back on Fri. May 19. The index closed the week at 7471 with a 35 points (about 0.5%) gain for the week. (At the time of writing this post, the index has moved up to 7500.)

Daily technical indicators are in bullish zones, but not showing much upward momentum. Some consolidation can be expected before the index touches another new high.

On longer term weekly chart (not shown), the index closed well above its three weekly EMAs in a long-term bull market. Weekly technical indicators are in bullish zones but showing negative divergences by failing to touch new highs with the index.

Sunday, April 9, 2017

Sensex, Nifty charts (Apr 07, 2017): 'Trump'ed-up corrections or technical weakness?

Activity remained muted in a holiday-shortened trading week. FIIs were net buyers of equity worth Rs 7.55 Billion; DIIs were also net buyers of equity worth Rs 0.48 Billion, as per provisional figures. Sensex and Nifty gained marginally on weekly closing basis.

Nikkei India Services PMI rose to a 5 month high of 51.5 in Mar '17 against 50.3 in Feb '17. A figure above 50 indicates expansion. "(India’s) rapid recovery from the demonetisation-related downturn was accompanied by job creation and softer inflationary pressures.”

To check excess liquidity in the system, narrow down money market rates and control inflation in FY18, RBI on Thu. Apr 6 increased the reverse repo rate by 25 basis points to 6% from 5.75% earlier.

BSE Sensex index chart pattern


The following were concluding comments in last week's post on the daily bar chart pattern of Sensex: "Announcement of FY 16-17 corporate results is expected to start in about two weeks. Some hesitation among bulls is only to be expected till then."

On Apr 5, the index rose to touch a new 52 week intra-day high of 30007 - testing, but falling just short of, the lifetime intra-day high of 30025 touched in Mar '15. Sensex ended the day at a lifetime closing high 29974.

Three of the four technical indicators - MACD, ROC, RSI - showed negative divergences by touching lower tops. That was a signal for a corrective move. Trump's cruise missile barrage at a Syrian airport exacerbated the index slide.

Note that the index closed just below trend line 2 - within the 3% 'whipsaw' limit, but it should be treated as a second warning about a possible trend change. (The first warning was a close below trend line 1.)

Sensex has formed a small 'rising wedge' pattern from which the likely break out is downwards. It is also possible that the index has formed the left shoulder and head of a 'head and shoulders' reversal pattern.

The index is trading above its three EMAs in a bull market, but is more than 2000 points above its 200 day EMA (an empirical observation of an overbought condition). Daily technical indicators are showing downward momentum. Some more correction or consolidation may follow.

NSE Nifty index chart pattern


The weekly bar chart pattern of Nifty touched a new high of 9274, but closed at 9198. For the 4th straight week, the index failed to close above the psychological level of 9200.

The index is trading well above its two rising weekly EMAs in a bull market. All four technical indicators are inside their overbought zones. ROC is showing signs of bearishness by crossing below its 10 week MA.

Nifty's TTM P/E remained above 23 during the week - well above its long-term average. The breadth indicator NSE TRIN (not shown) is rising in neutral zone - hinting at more consolidation or correction.

India's manufacturing and services PMI numbers are showing growth. Whether that growth will get reflected in India Inc's Q4 numbers or not may be keeping bulls on tenterhooks.

Bottomline? Sensex and Nifty charts are consolidating after sharp rallies triggered by hopes of better corporate earnings. Both indices are looking overvalued. Some more consolidation or correction is possible. Don't be in a rush to buy or sell. Try to look at the big picture.

Sunday, November 13, 2016

BSE Sensex and NSE Nifty charts (Nov 11, 2016): turning bearish after 'flag' patterns get breached on the downside

In a full week of trading, FIIs were net sellers of equity worth Rs 39 Billion, as per provisional figures. DIIs couldn't quite match them, as their net buying in equities totalled Rs 29 Billion.

Sensex lost 1.4% while Nifty lost 1.6% on a weekly closing basis. More ominously for bulls, both indices - looking shell-shocked after the demonetisation of Rs 500 and Rs 1000 bank notes - closed below the 'flag' patterns within which they were correcting since the beginning of Sep '16.

Things are slowly improving on the macroeconomic front. The IIP number rose to 0.7% in Sep '16 against a revised -0.99% in Aug '16 and FDI in the country rose to US $5.15 Billion in Sep '16 against US $2.9 Billion in Sep '15.

Modi's 'Make in India' campaign seems to be working for a few second-rung auto companies. During Apr-Sep '16 period, exports exceeded domestic sales by significant amounts for Ford's Ecosport (1.5x), VW's Vento (6x), GM's Chevy Beat (6x), Nissan Micra (10x).

BSE Sensex index chart pattern


The daily bar chart pattern of Sensex closed higher on the first two day's of the week on the back of FII buying. Note the following comments made in last week's post: "The index is approaching twin support from its 200 day EMA and the lower down trend line of the 'flag'. There may be a brief technical bounce."

It was also mentioned that bears may sell the rise and Sensex may fall below its 200 day EMA and fill 'Gap 2' formed on Jun 30. 

But Trump's unexpected victory in the US Presidential elections and Modi's announcement of demonetising of Rs 500 and Rs 1000 bank notes came out of the blue and caused a crash all the way down to the 25900 level during opening trade on Wed. Nov 9.

The index regained most of its losses during the day and closed within the 'flag' pattern. On Thu., it climbed above the 27600 level intra-day, but faced strong resistance from its falling 20 day EMA and closed below 27600.

Heavy selling by FIIs on Fri. Nov 11 triggered a drop below the 200 day EMA and the lower edge of the 'flag'. The index closed the week below the 'flag' and inside 'Gap 2'.

Daily technical indicators are looking bearish. MACD is falling towards its oversold zone. ROC and RSI are inside their respective oversold zones. Slow stochastic rose above its 50% level but its upward momentum has stalled.

Some more correction and/or consolidation is likely. An intra-day fall below the 'flag' on Wed. and a close below the 'flag' on Fri. are signs that the bullish 'flag' may get negated. 

Note that a single day's close within the 3% 'whipsaw' limit below the 'flag' has not yet negated the 'flag' technically.

Bulls will hope that the index can bounce up from 'Gap 2'. Their hopes may be belied. With the value of the Rupee falling against a strong US Dollar after Trump's win, FIIs are unlikely to start buying anytime soon. 

Small investors should not be in a hurry to start bottom fishing. A test of Wednesday's low of 25900 can't be ruled out.

NSE Nifty index chart pattern


Note the following comment made in Wednesday's post on the daily bar chart pattern of Nifty: "...the intra-day breach (of the 'flag') is a warning sign for bulls that the correction from the Sep '16 top may not be over yet."

The weekly bar chart pattern shows Wednesday's crash to the 8000 level, followed by a sharp recovery that failed to close inside the 'flag'. 

Bulls need not throw in the towel yet. Nifty is receiving twin support from its rising 50 week EMA and the 8300 level. Also, the index has closed within the 3% 'whipsaw' limit below the 'flag'.

Weekly technical indicators are looking bearish. MACD is falling below its signal line in positive zone. ROC, RSI, Slow stochastic are about to enter their respective oversold zones. Some more correction or consolidation around current levels is likely. 

Bottomline? Sensex and Nifty charts have closed below 'flag' patterns, showing bear domination. Valuations have improved a bit, but earnings growth of India Inc. is still sluggish. Caution is advised. Re-test of support from Wednesday's lows is a possibility.

Saturday, October 15, 2016

BSE Sensex and NSE Nifty charts (Oct 14, 2016): breakouts below descending triangles appear imminent

In a 3 day trading week (with holidays on Tue. & Wed.), FIIs were net sellers of equity worth Rs 24 Billion while DIIs were net buyers of equity worth Rs 17 billion. Both Sensex and Nifty closed about 1.3% lower for the week.

There was good and bad news on the macro-economic front. First the good. Both CPI and WPI inflation numbers in Sep '16 were lower than in Aug '16. Indirect tax collections grew 26% and direct tax collections grew 9% during the Apr-Sep '16 period.

Now, the bad. The IIP number in Aug '16 was -0.7% due to decline in manufacturing, mining and capital goods sectors. Stressed loans in India's banking sector increased by 15% in the Jan-Jun '16 period.

BSE Sensex index chart pattern


The daily bar chart pattern of Sensex shows a breakdown (marked by light blue circle) below the 'descending triangle' pattern. The breakdown is not technically valid yet. Why?

Two reasons. The index has closed within the 3% 'whipsaw' limit below the 27700 level (support level of the 'descending triangle' pattern). Also, the long-term support level of 27600 has not been breached on a closing basis.

The respite for bulls may be temporary. With FIIs in selling mood, a filling of the 'gap' formed on Jul 11 '16 (marked Gap1) and a test of support from the rising 200 day EMA seems almost inevitable.

Can the index bounce up from current level? The possibility can't be ruled out entirely. All four daily technical indicators are in bearish zones, with RSI and Slow stochastic looking oversold.

A likely scenario can be a drop to Gap1, followed by a pullback towards the 27700 level and then a bigger drop towards Gap2. (If such a scenario does play out, the pullback will be a shorting opportunity and the drop towards Gap2 will be a good buying opportunity.)

The long-term structure of the chart continues to remain bullish.

NSE Nifty index chart pattern


The following remark was made in last week's post on the weekly bar chart pattern of Nifty: "Some more consolidation within the triangle is likely till a downward break out can occur." 

Though the support level of the 'descending triangle' (at 8550) was breached intra-week, the index received good support from its 20 week EMA, and bounced up to close within the triangle.

Weekly technical indicators are turning bearish. MACD has crossed below its signal line and is about to drop from its overbought zone. ROC has slipped into its negative zone. RSI and Slow stochastic are falling towards their respective 50% levels.

A fall below the 20 week EMA appears imminent. Expect downside support from the 8350 level and the rising 50 week EMA.

Nifty's TTM P/E has dropped to 22.98, but is still above its long-term average. The breadth indicator NSE TRIN (not shown) is rising towards its oversold zone. Some more correction is likely.

Bottomline? Both Sensex and Nifty are poised to drop below bearish 'descending triangle' patterns. The likely dips will provide buying opportunities. Be stock specific. Accumulate slowly instead of jumping in feet first.

Sunday, March 20, 2016

BSE Sensex and NSE Nifty 50 index chart patterns – Mar 18, 2016

FIIs were net buyers of equity worth more than Rs 4000 Crores during the past week. DIIs were net sellers of equity worth Rs 2350 Crores, as per provisional figures. Forex reserves increased by $2.54 Billion during the week.

Since the beginning of the month, FII net buying in equity has touched Rs 12700 Crores, exceeding their net selling during Feb '16. DII net selling in equity month-to-date is worth Rs 8000 Crores.

Both Sensex and Nifty closed higher for the third week in a row - at their highest levels in more than 2 months. However, long-term resistance levels on both indices have not been convincingly breached yet - keeping bearish hopes alive.

Next week has only three trading sessions because of Holi and Good Friday holidays. Volumes may remain muted, and both indices are expected to consolidate near current levels. 

BSE Sensex chart pattern


The daily bar chart pattern of Sensex consolidated sideways with a slightly upward bias, and closed with a weekly gain of 235 points (about 1%).

The index traded the entire week above its 20 day and 50 day EMAs, and closed above the long-term resistance level of 24830. The 20 day EMA is about to cross above the 50 day EMA. These are bullish signs in the near term.

Note that the 200 day EMA is still sliding down, and the index is trading below it. The close above the 24830 level has not been a convincing one yet - because the index remains within the 3% 'whipsaw' limit above it. The blue downtrend line continues to rule the chart. These are longer term bearish signs.

Three of the four daily technical indicators - MACD, RSI, Slow stochastic - are inside their overbought zones. ROC has already corrected from its overbought zone, and crossed below its 10 day MA. 

Some more consolidation or a correction may be just around the corner. Any dip can be used to add to existing positions. The 23840 level should provide good support on the downside.

In case the rally continues on the back of buying by FIIs, overhead resistances can be expected from the 200 day EMA, the downtrend line and the 26300 level.

On longer term weekly chart (not shown), Sensex closed nearly 1400 points above its rising 200 week EMA in a long-term bull market, but is facing resistance from its 20 week EMA. Weekly technical indicators are showing some upward momentum, but MACD, ROC and RSI remain in bearish zones. 

NSE Nifty 50 chart pattern


The weekly bar chart pattern of Nifty 50 gained 94 points (1.25%) on a weekly closing basis. It closed above the long-term resistance level of 7540, and also above its 20 week EMA for the first time since the week ending on Oct 23 '15.

However, the index is trading below its falling 50 week EMA. The blue downtrend line continues to dominate the chart. Bears may have lost a couple of recent battles, but can regroup and fight back at any time.

Weekly technical indicators are showing upward momentum, but haven't quite turned bullish yet - except Slow stochastic, which has crossed above its 50% level. MACD has crossed above its signal line in negative zone. ROC and RSI are in neutral zones.

If the rally continues, expect resistances from the 50 week EMA, the 7950 level and the downtrend line. Any dip towards 7240 can be used as a buying opportunity.

Nifty closed almost 500 points above its rising 200 week EMA (not shown) in a long-term bull market. The scale is gradually tilting towards bulls.

Bottomline? Chart patterns of Sensex and Nifty have managed to close above long-term 'support/resistance' levels. Some correction or consolidation can be expected. Use any dips to enter fundamentally strong stocks. Long-term bull markets are gradually recovering from year-long corrections.

Monday, February 15, 2016

Stock Index Chart Patterns: S&P 500 and FTSE 100 – Feb 12, 2016

S&P 500 index chart


The following comments appeared in last week's post on the daily bar chart pattern of S&P 500: "All three EMAs are falling, and the index is trading below them in bear territory. The Jan 20 low of 1812 is likely to be tested."

The Jan 20 low of 1812 was tested on Thur. Feb 11 - as the index touched a new 52 week intra-day low of 1810 - but technically not breached because of the 3% 'whipsaw' rule.

On Fri. Feb 12, the index bounced up to close at 1865 - losing just 15 points on a weekly closing basis. Asian markets are in a bull grip at the time of writing this post. If S&P 500 continues to rally with good volume support and crosses above its Feb 1 top of 1947, a 'double bottom' reversal pattern will get technically confirmed.

All three daily technical indicators have corrected oversold conditions, and are showing positive divergences by touching higher bottoms while the index dropped slightly lower.

Is the correction over? It may be too early to call. But a sharp rally is quite possible.

On longer term weekly chart (not shown), the index bounced up after testing support from its 200 week EMA for the second time in 4 weeks, but closed well below its falling 20 week and 50 week EMAs. The long-term bull market is still intact, but may not remain so for long. Weekly technical indicators are in bearish zones and showing downward momentum.

FTSE 100 index chart


The following comments appeared in last week's post on the daily bar chart pattern of FTSE 100: "...the index has dropped below the 5750 level and looks ready to test and breach its Jan 20 low of 5640."

On Thu. Feb 11, the index dropped well below 5640 and touched a new 52 week intra-day low of 5499.50, before bouncing up to close at 5537. Technically, 5640 was not breached because of the 3% 'whipsaw' rule. 

If you think this is technical hair-splitting - a breach of a previous low should be considered a breach - then you may not be able to take advantage of the 3% 'whipsaw' rule. 

I'm not saying the index can't fall lower. But positive divergences visible on all three daily technical indicators - which failed to touch new lows with the index - can trigger a sharp rally that squeezes out shorts.

On longer term weekly chart (not shown), the index touched and closed at 3 year intra-week and closing lows. The 50 week EMA has just slipped below the 200 week EMA. Weekly technical indicators are in bearish zones, but showing positive divergences by failing to touch new lows with the index.

Saturday, February 13, 2016

BSE Sensex and NSE Nifty 50 index chart patterns – Feb 12, 2016

FIIs were heavy net sellers of equity worth more than Rs 3000 Crores last week, as per provisional figures. DIIs were net buyers of equity worth Rs 2050 Crores - not enough to prevent vertical plunges on Sensex and Nifty charts.

Retail (CPI) inflation inched up to 5.69% in Jan '16 from 5.61% in Dec '15, due to higher food prices. The Jan '15 number was 5.19%. Rising inflation may prevent any further interest rate cuts by RBI.

The IIP number for Dec '15 was -1.3%. It was the second month of contraction. In Nov '15 IIP was -3.4%. In Q3, IIP was 1.5% vs. 4.8% in Q2. However, for the 9 months period from Apr to Dec '15, IIP was 3.1% against 2.6% for the same period in 2014. 

Auto sales slipped marginally (-0.72%) in Jan '16 on a YoY basis after 14 straight months of growth. The good news is robust double-digit growth in CV sales.

BSE Sensex chart pattern


The daily bar chart pattern of Sensex dropped vertically like a falling knife, as it sliced through known support levels to touch a 21 months low of 22600 on Friday, Feb 12. The unfilled 'gap' formed back in May '14 in the euphoria of NDA's election victory was filled easily.

Daily technical indicators are inside their oversold zones. However all three are showing positive divergences by not falling lower with the index.

Though an index can stay oversold for long periods during bear phases, a technical bounce may be imminent. The index formed a 'reversal day' pattern (lower low, slightly higher close) with strong volume support (not shown on chart).

Sensex closed the week more than 3000 points below its 200 day EMA. Such a huge drop below the 200 day EMA in a short span of time is unsustainable.

In candlestick parlance, Friday's trading formed a 'hammer' pattern, which usually has bullish implications when formed at the end of a down trend. Next week's trading will indicate whether bulls will be in a mood to fight back.

The index dropped below its 200 week EMA (not shown) for the first time since Aug '13, but managed to close within the 3% 'whipsaw' limit. The long-term bull market is now under threat.

NSE Nifty 50 chart pattern


The weekly bar chart pattern of Nifty 50 collapsed on heavy selling by FIIs, touching its lowest level since May '14 and breaching the 200 week EMA for the first time since Aug '13.

A close below the 200 week EMA is considered very bearish. But a single week's breach should not cause panic. Faint bullish hopes were kept alive as the index closed the week within the 3% 'whipsaw' limit below its 200 week EMA.

Weekly technical indicators are looking oversold and showing downward momentum. If the index fails to bounce up within the next 2-3 trading weeks, much lower levels may be on the cards.

How much lower? Check the previous post on Nifty. Likely lower support levels have been mentioned there.

Bottomline? Chart patterns of Sensex and Nifty have closed below their respective 200 week EMAs. Long-term bull markets are now under real threat. This is not the time to panic and sell off. Stick to your investment plans. Bottom fishing should be attempted in a very gradual manner - if at all.

Saturday, January 16, 2016

BSE Sensex and NSE Nifty 50 index chart patterns – Jan 15, 2016

Plummeting oil price and a crash in the Chinese stock market continues to spook FIIs, who have been on a selling spree across global markets. Already there is talk about a 2008-like bear market - specially from those experts who propound the 8 years market cycle.

As per provisional figures, FIIs were net sellers of equity worth Rs 4300 Crores last week. Their total sales during the first half of the month has crossed Rs 7600 Crores. DIIs were net buyers of equity worth Rs 3900 Crores last week. Their total buying during the first half of Jan '16 was Rs 5350 Crores.

WPI inflation number for Dec '15 was -0.73%, its 14th straight month of contraction. The revised figures for Nov '15 and Oct '15 are -1.99% and -3.7% respectively. Food inflation rose to 8.17% - its steepest rise in 17 months.

BSE Sensex chart pattern


The daily bar chart pattern of Sensex spent a volatile week, oscillating within a range of 630 points near the support level of 24830 (which had provided support to the index in Sep '15 and Dec '15).

The index closed near the lowest point of the week - 375 points below the support level of 24830 - losing about 1.7% on a weekly closing basis. A bearish pattern of 'lower tops and lower bottoms' that got briefly stalled in Dec '15 has resumed.

The index is trading well below its blue downtrend line and its three falling daily EMAs in a bear market. So, is it 'game over' for bulls?

Not quite. All four technical indicators are looking oversold, which can lead to a technical bounce at any time. Also, the fall below the support level of 24830 remains within the 3% 'whipsaw' limit - keeping faint bullish hopes alive.

Whether any technical bounce will be strong enough to reverse the 10 months long downtrend is a moot point. Sensex is still trading 950 points above its 200 week EMA in a long-term bull market.

NSE Nifty 50 chart pattern


The weekly bar chart pattern of Nifty dropped and closed 100 points below the support level of 7540, losing 2.1% on a weekly closing basis. The index has resumed its bearish pattern of 'lower tops and lower bottoms'.

Nifty is trading below its blue downtrend line and its two falling weekly EMAs in a bear market. The 50 week EMA is forming a bearish 'rounding top' pattern.

Weekly technical indicators are in bearish zones and showing downward momentum, hinting at a continuation of the correction. However, all four indicators are beginning to look oversold, which could lead to a technical bounce.

The breadth indicator TRIN (not shown) is rising inside its oversold zone - indicating that a counter-trend move may be around the corner. It is unlikely that such a move will lead to a change of trend because of the bearish mood of FIIs.

Bottomline? Chart patterns of Sensex and Nifty have breached long-term support levels, leaving the door open for deeper corrections. Long-term bull markets are still intact, as both indices are trading above their rising 200 week EMAs (not shown). Use the dip to accumulate slowly. You don't need to be greedy just because others are fearful.

(Note: Learn how to choose fundamentally strong mid-cap and small-cap stocks. Become a paid subscriber of my Monthly Investment Newsletter. A limited number of new subscriptions are being offered till Jan. 21, 2016. Enrolments have started. Contact me for details:mobugobu@yahoo.com.)

Wednesday, January 13, 2016

Nifty chart: a midweek update (Jan 13 ‘16)

The Indian economy seems to be taking one step forward and two steps back. Domestic passenger car sales during Dec '15 grew almost 13% YoY - its 14th straight month of growth. Sales of M&HCVs grew 19%, but two-wheeler sales declined 3%. 

However, IIP showed degrowth of 3.2% in Nov '15 YoY - its worst show in 4 years - against a revised 9.9% growth in Oct '15. CPI inflation inched up to 5.61% in Dec '15 YoY against 5.41% in Nov '15. Further interest rate cuts by RBI is unlikely any time soon.

This week, FII net selling in equities has crossed Rs 1930 Crores. DIIs were net buyers of Rs 1660 Crores, as per provisional figures. Month-to-date in Jan '16, FII net selling has crossed Rs 5200 Crores, while DII buying has touched Rs 3100 Crores.


The long-term closing chart pattern of Nifty 50 may be forming a 'rounding top' reversal pattern (more clearly visible on the 200 day EMA). Bulls have so far managed to defend the long-term support level of 7550 - despite a day's close below it on Tue. Jan 12 '15.

Today's price recovery late in the trading day, with strong volume support, may have brought some temporary respite for bulls. On the daily bar chart pattern of Nifty below, a 'reversal day' pattern (lower low, higher close) has formed. That may end the intermediate downtrend - like it did exactly a month ago.


Candlestick pattern experts (not me) may identify today's price bar as a 'dragonfly doji' or a 'hammer', both of which have bullish implications when formed at the end of a down move.

The importance and significance of the 7550 level was explained in last week's update. Lower support levels in case of a convincing breach of 7550 were also mentioned in last week's update.

Note that 7550 did get breached on a closing basis yesterday (Jan 12 '15). But it wasn't a 'convincing breach'. Why? Because of the 3% 'whipsaw' rule. What is that?

It is a simple rule that differentiates a token breach from a convincing one. A convincing breach - particularly of a long-term support (or resistance) level - requires a close beyond 3% of the actual support (or resistance) level.

In this case, a convincing breach would require Nifty to close below 7323 (i.e. 7550 - 3% of 7550). That gives bulls another 225 odd points to play with.

There is no guarantee that FIIs will stop selling - though their net selling today was overshadowed by DII buying. So, Nifty may very well close below 7323 and fall even further.

Daily technical indicators - which look oversold - are showing some signs of upward momentum. It will require considerable buying support to break the bear stranglehold on Nifty's chart.

So, are you getting paralysed by fear, or getting ready to jump into the market feet first? Do neither. Remain circumspect, but maintain your SIPs and/or accumulate good stocks with suitable stop-losses.

As I have been harping for a while, the long-term bull market is intact.

(Note: Thinking of adding quality mid-cap and small-cap stocks to your portfolio? Subscribe to my Monthly Investment Newsletter. Paid subscriptions are being offered to blog visitors, followers and subscribers till Jan 21, 2016. Contact me at mobugobu@yahoo.com for details.)

Monday, June 22, 2015

Stock Index Chart Patterns: S&P 500 and FTSE 100 – Jun 19, 2015

S&P 500 Index Chart

S&P 500_Jun1915 

The daily bar chart pattern of S&P 500 took investors on another roller-coaster ride last week. The index dropped to an intra-day low of 2072 on Mon. Jun 15 – forming a small ‘double bottom’ reversal pattern.

Over the next 3 days, it rallied past its 20 day and 50 day EMAs – closing above the 2120 level in bull territory on Thu. Jun 18. On the last day of the week, the index corrected sharply – backed by the strongest volumes in 3 months.

Note that the index closed above its three daily EMAs in a long-term bull market – but at the same level that it closed more than 4 months back, and appears to be undergoing a sideways consolidation within a large bearish ‘rising wedge’ pattern.

Strong volumes on down-days may be a sign of ‘distribution’ from stronger to weaker hands.

Daily technical indicators are giving mixed signals. MACD crossed above its signal line in negative zone, but its upward momentum is weak. RSI is above its 50% level, but moving down. Slow stochastic is moving up towards its overbought zone.

Volatile index movements is often a sign of a change of trend. Stay invested, but remain watchful.

On longer term weekly chart (not shown), the index dropped below its 20 week EMA intra-week, but closed above its three weekly EMAs in a long-term bull market. Weekly technical indicators are in bullish zones, and showing slight upward momentum.

FTSE 100 Index Chart

FTSE_Jun1915

The following comments appeared in last week’s post on the daily bar chart pattern of FTSE 100: “…the index has so far closed within the 3% ‘whipsaw’ limit below its 200 day EMA. That means the breach below the 200 day EMA has not been technically validated yet. Only a close below 6600 will do that.”

On Thu. Jun 18, the index dropped to an intra-day low of 6625 – testing the 3% ‘whipsaw’ limit below the 200 day EMA, but bounced up to close above the 6700 level. Despite the sharp correction, the breach below the 200 day EMA awaits technical confirmation.

It may be a temporary respite for bulls. The 20 day EMA is ready to drop below the 200 day EMA. The 50 day EMA is falling towards the 200 day EMA. The 200 day EMA has started sliding down. These are bearish signs.

A last-minute resolution of Greek’s sovereign debt problems may act as a positive trigger for bulls.

Daily technical indicators are in the process of correcting oversold conditions. MACD is inside its oversold zone, but has stopped falling. RSI has bounced up from the edge of its oversold zone. Slow stochastic is trying to emerge from its oversold zone.

Note that RSI and Slow stochastic are showing positive divergences by not touching lower lows with the index. The index may pull back to test resistance from its 200 day EMA.

On longer term weekly chart (not shown), the index dropped sharply below its 50 week EMA and closed below it. The 200 week EMA is still rising, and the index is trading well above it in a long-term bull market. Weekly technical indicators are looking bearish but showing signs of upward momentum.

Monday, June 15, 2015

Stock Index Chart Patterns: S&P 500 and FTSE 100 – Jun 12, 2015

S&P 500 Index Chart

S&P 500_Jun1215

The following remarks were made in last week’s post on the daily bar chart pattern of S&P 500: “Slow stochastic has dropped sharply inside its oversold zone. That can lead to a technical bounce. Bears are likely to use any rally to sell.”

The index dropped to an intra-day low of 2072 on Tue. Jun 9, but formed a ‘reversal day’ pattern (lower low, higher close). Over the next two days, the index rose sharply above its 20 day and 50 day EMAs into bull territory, but touched a lower intra-day high of 2115 on Thu. Jun 11.

As expected, bears used the brief rally to sell. The index dropped below its 20 day and 50 day EMAs and the 2100 level, and closed flat for the week. The down trend from the small ‘double top’ at 2134 (touched on May 20 & 21) continues.

Daily technical indicators are turning bearish. MACD is below its signal line in negative zone, and is turning down. RSI faced resistance from its 50% level, and is moving down. Slow stochastic managed to creep above its 50% level, but its upward momentum is slowing down.

Some more correction is likely. Note that the index is trading well above its rising 200 day EMA in a long-term bull market.

On longer term weekly chart (not shown), the index dropped below its 20 week EMA intra-week, but managed to close above its three weekly EMAs in a long-term bull market. Weekly technical indicators are still in bullish zones, but showing downward momentum.

FTSE 100 Index Chart

FTSE_Jun1215

The following comments appeared in last week’s post on the daily bar chart pattern of FTSE 100: “A technical bounce is a possibility - but bears have a firm grip on the chart.”

The index dropped below the 6750 level intra-day on Tue. Jun 9, but closed just above it at 6754. FTSE bounced up nicely above its 200 day EMA over the next two days, but failed to test its falling 20 day or 50 day EMAs.

Bears used the opportunity to sell. The index dropped and closed below all its three EMAs in bear territory. It also closed below the 6800 level for the first time since Mar 31 ‘15. The down trend from the Apr 27 ‘15 lifetime top of 7123 continues.

Note that the index has so far closed within the 3% ‘whipsaw’ limit below its 200 day EMA. That means the breach below the 200 day EMA has not been technically validated yet. Only a close below 6600 will do that. At the time of writing this post, the index is struggling to stay above the 6750 level.

Daily technical indicators are looking bearish and a bit oversold. MACD is falling below its signal line, and entered its oversold zone. RSI is falling below its 50% level after bouncing up weakly from the edge of its oversold zone. Slow stochastic has re-entered its oversold zone. Expect bulls and bears to fight for control of the 200 day EMA.

On longer term weekly chart (not shown), the index dropped sharply below its 50 week EMA but managed to close near it. The 200 week EMA is still rising, and the index is trading well above it in a long-term bull market. Weekly technical indicators are looking bearish and showing downward momentum.

Sunday, June 14, 2015

BSE Sensex and NSE Nifty 50 index chart patterns – Jun 12, 2015

Finally some good news to counter the bearish ‘poor monsoon’ sentiment. The IIP number – aided by growth in manufacturing and cap. goods sectors – came in higher than consensus estimate at 4.1% in Apr ‘15 vs. 2.1% in Mar ‘15. However, CPI inflation inched up above 5%, which is not so good news.

FIIs remained net sellers of equity during the week. As per provisional figures, their net selling during the first two weeks in Jun ‘15 has crossed Rs 4400 Crores. That figure was offset by the DIIs, whose net buying in equities was almost Rs 5700 Crores.

Down trends – marked by blue trend lines – continue to dominate both Sensex and Nifty charts below. Both indices closed lower for the third straight week – to their lowest levels in nearly 8 months.

BSE Sensex index chart

Sensex_Jun1215

The daily bar chart pattern of Sensex dropped below the May ‘15 low of 26424, and is seeking support from the 26300 level – which corresponds to the top touched in Jul ‘14. Will the support hold?

Technical signs are bearish. The 20 day EMA has crossed below the 200 day EMA – for the first time since Aug ‘13. The 50 day EMA is falling towards the 200 day EMA, and a convincing cross below (‘death cross’) will confirm a bear market.

Daily technical indicators are bearish and looking oversold. MACD is falling below its signal line towards its oversold zone. ROC has entered its oversold zone after failing to cross above its falling 10 day MA. RSI is trying to emerge from its oversold zone. Slow stochastic is well inside its oversold zone.

The index has closed below its 200 day EMA for 9 straight trading sessions. But all is not gloom and doom – yet. Why? Because the index has so far closed within the 3% ‘whipsaw’ limit below the 200 day EMA.

Technical nitpicking, you think? On such nitpicking are fortunes made! In other words, there is a possibility of a technical bounce from current level. Whether it turns into a full fledged rally or not will depend a lot on the progress of the monsoon and Q1 results to be announced from next month.

Whatever you do, do not sell in a panic. It is a difficult thing to do when your portfolio value keeps diminishing every day. These are tests that you need to pass if you want to build wealth during long-term bull markets.

NSE Nifty 50 index chart

Nifty_Jun1215

The weekly bar chart pattern of Nifty closed below the 8000 level (at 7983) for the first time since the week ending on Oct 17 ‘14, and below its 50 week EMA for the first time since the week ending on Sep 6 ‘13.

Since the index closed within the 3% ‘whipsaw’ limit below its 50 week EMA, the breach is technically not valid yet. But that may be a small respite for bulls.

Weekly technical indicators are bearish and looking oversold. MACD is falling below its signal line, and entered negative zone. ROC and RSI have dropped to the edge of their respective oversold zones. Slow stochastic has entered its oversold zone.

Oversold conditions may prevail for long periods during bear markets. In bull markets – and technically Nifty is still in a bull market – oversold conditions are usually of shorter durations.

Slow stochastic and ROC (not clearly visible) have both touched slightly higher bottoms than the ones they touched in May ‘15. The positive divergences may lead to a technical bounce, if not a rally.

The NSE TRIN (a breadth indicator) is looking extremely oversold – at a level not seen in the past 2 years.

Bottomline? Bears are still dominating BSE Sensex and NSE Nifty charts, and will remain dominant as long as both indices trade below their respective down trend lines. Technical bounces in both indices are likely. Stay invested, but remain cautious.