Wednesday, May 31, 2017

Nifty chart: a midweek technical update (May 31 ‘17)

For the month of May '17, FIIs were net sellers of equity worth Rs 4.5 Billion, which included today's net buying of equity worth Rs 10.5 Billion - as per provisional figures.

DII were net buyers of equity worth Rs 42.8 Billion, which included today's net selling worth Rs 9.4 Billion. Nifty gained more than 300 points (3.4%) for the month.

India's GDP growth in FY 2016-17 slowed down to a three year low of 7.1% against 7.9% (revised upwards to 8% due to revisions in IIP and WPI series) in FY 2015-16. Q4 (Mar '17) GDP growth fell to 6.1% against 7% in Q3 (Dec '16) - thanks to demonetisation


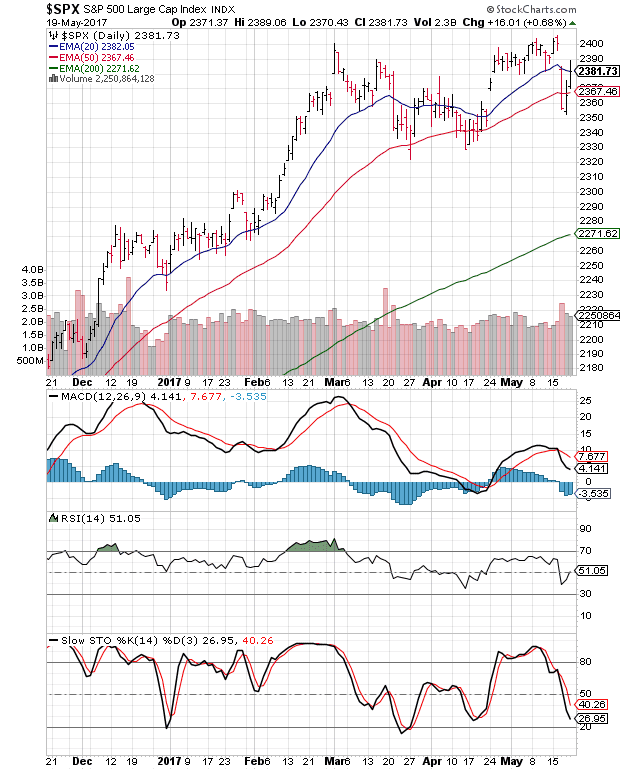
The daily bar chart pattern of Nifty received good support from its 20 day EMA and bounced up strongly. It rallied past the 9600 level for the first time ever on May 26, and touched a new high of 9649.60 today.

All three EMAs are rising, and the index is trading above them in a bull market. However, daily technical indicators are looking overbought, and showing negative divergences by failing to touch new highs with the index. 

The index is more than 800 points above its 200 day EMA - an empirical observation of an overbought condition that usually precedes a correction.

Nifty's TTM P/E ended the month at 24.35 - well above its long-term average - after rising to a high of 25.23 on May 17th. Decent earnings growth of Nifty component companies helped to moderate P/E growth.

(On a two years forward earnings estimate, Nifty's P/E is at a reasonable 15.5. But forward earnings estimate should be taken with a pinch of salt. It had to be revised downwards considerably for FY 2016-17.)

The breadth indicator NSE TRIN (not shown) has risen towards its oversold zone - giving an interesting contra-indication of more upside for the index.

So, will the index rally first and then correct? Or, will it correct first and then rally? 

For small investors, guessing market movements is a waste of time and energy. Don't fight the trend - which is clearly up. Stay invested, but maintain a stop-loss.

Tuesday, May 30, 2017

WTI and Brent Crude Oil charts: bears strike again

WTI Crude Oil chart


The following comments appeared in the previous post on the daily bar chart pattern of WTI Crude Oil: "The rally may continue till 51-51.50. Expect bears to start selling at any time."

Oil's price rallied to touch a high of 52 on Thu. May 25 '17 but plummeted below all three EMAs to 48.50 with a huge volume spike - forming a large 'reversal day' bar (higher high, lower close).

On Fri. May 26, oil's price dropped a little lower, but bounced up to close exactly at its 50 day EMA - forming another 'reversal day' bar (lower low, higher close).

OPEC and non-OPEC producers agreed to extend current level of production cuts till Mar '18. The market was perhaps expecting additional cuts - or, it was a case of 'sell on news'. The reasons don't really matter.

Since the beginning of the year, oil's price has formed a bearish pattern of 'lower tops, lower bottoms'. Till that pattern gets reversed, expect bears to sell on every rise.

Daily technical indicators are looking neutral to bearish. MACD and RSI are in neutral zones, but not showing much upward momentum. Slow stochastic has dropped sharply from its overbought zone.

Huge oil inventories in USA and oversupply in the market is likely to keep prices depressed. Saudi Arabia is trying to 'balance' the market by cutting exports to USA.

On longer term weekly chart (not shown), oil's price formed a 'reversal bar' and closed well below its 200 week EMA in a long-term bear market. Weekly technical indicators are in neutral zones. Only Slow stochastic is showing some upward momentum.

Brent Crude Oil chart


The following comments appeared in the previous post on the daily bar chart pattern of Brent Crude Oil: "The rally may have further upside - to 53-53.50. But bears are likely to 'sell the rise' at any time."

Oil's price rallied past 54.50 intra-day on Wed. May 24, but dropped to close below 54. The next day, it again crossed above 54.50 intra-day, but plunged below its three EMAs to 51 on the back of a strong volume surge.

On Fri. May 26, oil's price bounced up to close at its 50 day EMA - and above its 20 day and 200 day EMAs in bull territory. 

But the bearish pattern of 'lower tops, lower bottoms' since the beginning of the year is still in force. Bears are very much on top.

Daily technical indicators are not showing any upward momentum. MACD and RSI are at their respective neutral zones. Slow stochastic has fallen like a stone from its overbought zone.

Expect bears to continue their selling at every rise.

On longer term weekly chart (not shown), oil's price formed a 'reversal bar' and closed well below its sliding 200 week EMA in a long-term bear market. Weekly technical indicators are in neutral zones. Only Slow stochastic is showing some upward momentum.

Monday, May 29, 2017

S&P 500 and FTSE 100 charts (May 26 '17): bears routed - both indices touch lifetime highs

S&P 500 index chart pattern


The following remarks appeared in last week's post on the daily bar chart pattern of S&P 500: "Bears have successfully defended the 2400 level for almost 3 months. However, the next bull charge may overwhelm them."

The index moved up to test its May 16 '17 top of 2406 on Wed. May 24. Next day, the index opened with a small upward 'gap' and rose to touch a new high of 2419, but closed 3 points lower on Fri. May 26 - gaining 1.4% for the week.

Time to celebrate for bulls? Technical headwinds can cause a delay. Volumes have been sliding during the last leg of the rally (from the May 18 low of 2353), which is a bearish sign. 

All three technical indicators are in bullish zones, but showing negative divergences by failing to touch new highs with the index. Slow stochastic is well inside its overbought zone. 

Some consolidation around current levels and a pullback towards 2400 are possibilities. 

On longer term weekly chart (not shown), the index closed well above its three rising weekly EMAs in a long-term bull market. Weekly technical indicators are showing negative divergences by failing to touch new highs with the index.

FTSE 100 index chart pattern


The following comments were made in last week's post on the daily bar chart pattern of FTSE 100: "Some consolidation can be expected before the index touches another new high."

The index consolidated sideways within a 60 points range during the first four days of the week before rising up to touch a new high of 7554 on Fri. May 26. It closed just below 7550, with a 1% gain for the week.

Daily technical indicators are looking overbought. Two of them - RSI, Slow stochastic - are showing negative divergences by failing to touch new highs with the index.

The index has been trading within a bearish 'rising wedge' pattern for the past two weeks. If the pattern plays out, expect a correction towards 7400-7450.

On longer term weekly chart (not shown), the index closed well above its three weekly EMAs in a long-term bull market. Weekly technical indicators are looking overbought and showing negative divergences by failing to touch new highs with the index.

Sunday, May 28, 2017

Sensex, Nifty charts (May 26, 2017): touch new highs as bulls overrun bears

FIIs were net sellers of equity worth Rs 3.25 Billion during the week, as per provisional figures. But they were net buyers on Wed.(May 24) and Thu.(May 25). DIIs were net buyers of equity worth Rs 25.8 Billion, but were net sellers on Thu.

Sensex and Nifty broke out of sideways consolidations to touch lifetime highs. Market experts have started talking about much higher index targets - and that should be a signal for extreme caution.

India has retained its No. 1 position as world's top greenfield FDI investment destination for the second straight year - ahead of China and USA. FDI by capital investment rose 2% to US $62.3 Billion in 809 projects during 2016.

BSE Sensex index chart pattern


The daily bar chart pattern of Sensex was in consolidation mode till mid-week. A sudden spate of buying by FIIs on Thu. May 25 launched the index above its trading range. 

DIIs picked up the buyers' mantle on Fri. - propelling the index above the 31000 level for the first time ever.

'Fan line 3' and the 20 day EMA have provided good support to the index during the month. All three EMAs are rising, and the index is trading above them in a bull market.

Any sense of euphoria should be tempered with caution. Daily technical indicators are looking overbought. Three of them - MACD, ROC, Slow stochastic - are showing negative divergences by failing to touch new highs with the index.

An index can remain overbought for long periods during a bull market. But the negative divergences can lead to some correction or consolidation.

Stay invested. Maintain SIPs. Remember that wealth creation is comparatively easier. Wealth preservation is more difficult. Judicious profit booking is better than impulsive buying near an index top.

NSE Nifty index chart pattern


The weekly bar chart pattern of Nifty touched a new high of 9605 on Fri. May 26 but closed 10 points lower. It was the first time ever that the index managed to cross above 9600.

Both the weekly EMAs are rising, and the index is trading above them in a bull market - with no known resistances. In such situations, the index often stalls near a round figure.

(The index had crossed above 9100 for the first time ever in Mar '15 - but had failed to close above 9100 till two years later. The same pattern may not get repeated. But it is good to learn from history - so that mistakes are not repeated.)

Weekly technical indicators have been looking overbought for the past 4 months. However, ROC, RSI and Slow stochastic are showing negative divergences by failing to touch new highs with the index. Some consolidation or correction may follow.

Nifty's TTM P/E is at 24.32 - a bit lower than last week but much above its long-term average. The breadth indicator NSE TRIN (not shown) is rising inside its neutral zone, hinting at some more upside.

Bottomline? Sensex and Nifty charts are touching new highs on a regular basis. Both indices are looking overbought. Corporate earnings have not caught up with index valuations yet. Liquidity flow is keeping the stock market buoyant. Stay invested but maintain a trailing stop-loss.  

Wednesday, May 24, 2017

Nifty chart: a midweek technical update (May 24 ‘17)

FIIs were net sellers of equity worth Rs 6.4 Billion in the first three days of trading during F&O expiry week. DIIs were net buyers of equity worth Rs 18.1 Billion, as per provisional figures.

Nifty closed just below its 20 day EMA, losing 67 points from last Friday's closing level of 9428, but is trading well above its rising 50 day and 200 day EMAs in a bull market. 

The Government has abolished the 25 years old FIPB (Foreign Investment Promotion Board) since 90-95% of the sectors are already under the automatic route. Individual ministries will look after the 11 sectors not covered under automatic route. 


The daily bar chart pattern of Nifty has corrected almost 200 points since touching a lifetime high of 9533 on Wed. May 17.

Several overbought technical indications had suggested the possibility of an impending correction (refer last week's post).

Daily technical indicators have corrected overbought conditions, and are turning bearish. MACD has crossed below its signal line in bullish zone. RSI has dropped into neutral zone and is seeking support from its 50% level. Slow stochastic has slipped below its 50% level in neutral zone.

The index had opened with an upward 'gap' of 25 points (between 9225 and 9250) on Apr 25. That 'gap' remains unfilled till date. Nifty may attempt to fill this 'gap' either partly or completely - after which the up move should resume.

Can the index fall below the 'gap' (marked in grey on the chart)? If FIIs continue to sell, anything can happen. 

However, the rising 50 day EMA is just below the lower edge of the 'gap' - and should provide some support. Also, FIIs were net buyers of equity today. They may increase their buying on a further dip.

In case Nifty falls below its 50 day EMA, stronger support can be expected from the zone between 9000 and 9100.

Nifty's TTM P/E is at 24.73 - much higher than its long-term average. The breadth indicator NSE TRIN (not shown) has risen sharply from its overbought zone into neutral zone.

Some more correction or consolidation is possible before the index decides which way it wants to move.

Stay invested, but maintain a stop-loss - just in case FIIs turn aggressive sellers. 

Tuesday, May 23, 2017

Gold and Silver charts: bulls fight back after strong bear attacks

Gold chart pattern


Oversold technical indicators on the daily bar chart pattern of Gold aided a strong fightback by bulls.

Gold's price climbed above its three EMAs into bull territory, but is facing resistance from the 1265 level (which happens to be its Feb 27 '17 top).

Daily technical indicators have turned bullish. MACD has crossed above its signal line in bearish zone. RSI has moved above its 50% level. Slow stochastic has risen to the edge of its overbought zone.

A convincing move above 1265 can lead to a test of the Apr 17 top. Bears may use the rise to sell again.

On longer term weekly chart (not shown), gold’s price closed above its three weekly EMAs in long-term bull territory. Weekly technical indicators are in neutral zones but showing a bit of upward momentum.

Silver chart pattern


Heavily oversold technical indicators had led to the following comment in the previous post on the daily bar chart pattern of Silver: "A pullback rally towards 16.75 is a possibility. Bears may use any rally to sell again."

The pullback rally climbed above the 20 day EMA and continued up to 17.20 - where it faced strong resistance from the falling 50 day EMA. 

The 'death cross' of the 50 day EMA below the 200 day EMA has technically confirmed a return to a bear market. Expect bears to start selling at any time.

Daily technical indicators have turned bullish. MACD has crossed above its signal line in bearish zone. RSI has just crossed above its 50% level. Slow stochastic is rising towards its overbought zone.

Silver's price will require a strong move above its sliding 200 day EMA to escape from the bear stranglehold on the chart.

On longer term weekly chart (not shown), silver’s price faced resistance from its entangled 20 and 50 week EMAs, and closed below its three weekly EMAs in a long-term bear marketWeekly technical indicators are in bearish zones but showing slight upward momentum.

Monday, May 22, 2017

S&P 500 and FTSE 100 charts (May 19 '17): bears down but yet to be counted out

S&P 500 index chart pattern


Negative divergences visible on technical indicators had led to the following comment in last week's post on the daily bar chart pattern of S&P 500: "Some more correction or consolidation is likely before a convincing break out above 2400 can occur." 

On Mon. May 15, the index closed at 2402 - but it wasn't a convincing close above 2400 because of the '3% whipsaw rule.' The next day, the index touched a new intra-day high of 2405 only to close slightly lower than Monday's closing level - forming a 'reversal day' bar.

That was just the trigger bears needed to jump into action. The index opened trading with a downward 'gap' below its 20 day EMA on Wed. May 17, and fell sharply below its 50 day EMA with huge volumes to close at its lowest level in 4 weeks.

On Thu. May 18, the index dropped a little lower (to 2353) but closed higher - forming another 'reversal day' bar with good volume support - completely filling the upward 'gap' formed on Apr 24. That encouraged bulls to fight back. 

The index closed the week above its 50 day EMA but just below its sliding 20 day EMA - partly filling Wednesday's downward 'gap' and losing 9 points for the week.

Daily technical indicators are looking bearish. MACD is falling below its signal line in bullish zone. RSI dropped below its 50% level but has moved up to neutral zone. Slow stochastic is falling below its 50% level towards its oversold zone.

Bears have successfully defended the 2400 level for almost 3 months. However, the next bull charge may overwhelm them. Expect some more consolidation till then.

On longer term weekly chart (not shown), the index formed a weekly 'reversal bar' (higher high, lower close) but closed well above its three rising weekly EMAs in a long-term bull market. Weekly technical indicators are correcting overbought conditions.

FTSE 100 index chart pattern


In last week's post on the daily bar chart pattern of FTSE 100, the following likely index movements were mentioned:

- a test of the Mar 17 top of 7447
- a pullback towards 7400
- a convincing move above 7450 that could put bulls back on the driver's seat

On Mon. May 15, the index easily crossed above 7447 and closed at 7454. The next day, the index soared to a new high of 7534 with strong volume support, and closed at 7522. 

On Wed. May 17, the index touched a slightly lower top of 7533 - forming a small 'double top' reversal pattern that brought bears back into action. On Thu. May 18, the index dropped below 7400 to touch an intra-day low of 7389 with strong volumes.

Bulls fought back on Fri. May 19. The index closed the week at 7471 with a 35 points (about 0.5%) gain for the week. (At the time of writing this post, the index has moved up to 7500.)

Daily technical indicators are in bullish zones, but not showing much upward momentum. Some consolidation can be expected before the index touches another new high.

On longer term weekly chart (not shown), the index closed well above its three weekly EMAs in a long-term bull market. Weekly technical indicators are in bullish zones but showing negative divergences by failing to touch new highs with the index.

Sunday, May 21, 2017

Sensex, Nifty charts (May 19, 2017): rally to touch new highs, but bulls looking a bit tired

During the week, FIIs were net sellers of equity worth Rs 9.9 Billion while DIIs were net buyers of equity worth Rs 13.9 billion. Interestingly, during the first two days of the week, FIIs were net buyers and DIIs were net sellers.

Sensex closed about 0.9% higher, and Nifty closed about 0.3% higher on a weekly closing basis. Both indices touched new highs during the week.

Different slabs of GST rates have been finalised at a recent meeting of state Finance Ministers in Srinagar, and implementation from July 1 seems on the cards. However, the feisty West Bengal CM is trying to put a spanner in the works by claiming that small businesses are not yet ready to implement GST.

BSE Sensex index chart pattern


The following remark was made in last week's post on the daily bar chart pattern of Sensex: "... the bullish structure is looking a bit shaky as any downward breach of 'fan line 3' can bring bears to the fore."

The index rose to touch a new high of 30712 on Fri. May 19, only to drop lower and seek support from 'fan line 3' before bouncing up.

Bulls may heave a sigh of relief that 'fan line 3' was not breached. But if FIIs remain in selling mode, that support may get breached soon.

All three EMAs are rising, and the index is trading above them in a bull market. However, Q4 (Mar '17) results show that corporate earnings are lagging behind index valuation.

Technical indicators are in bullish zones, but giving conflicting signals. MACD is moving sideways. ROC and RSI have reversed their downward slide. Slow stochastic is about to drop from its overbought zone.

All four are showing negative divergences by failing to touch new highs with the index. Expect some consolidation or correction.

NSE Nifty index chart pattern


The weekly bar chart pattern of Nifty touched a new high of 9533 but could not sustain above the 9500 level.

The index closed just below its opening level of the week (9434) to form a 'shooting star' candlestick pattern that often marks the end of an intermediate up move. (Note a similar pattern that formed in the week ending on Sep 9 '16.)

The index is trading well above its two weekly EMAs in a bull market. Weekly technical indicators are inside their respective overbought zones. Three of them - ROC, RSI, Slow stochastic - are showing negative divergences by failing to touch new highs with the index.

Nifty's TTM P/E is at 24.91 - much above its long-term average. The breadth indicator NSE TRIN (not shown) is falling deeper inside its overbought zone.

A correction towards the Mar '15 top of 9119 will improve the technical 'health' of Nifty's chart and provide a good adding opportunity. But hoping for a correction never caused one. It'll happen when it is least expected.

Bottomline? Sensex and Nifty charts continue to touch new highs. Both indices are looking overbought. Corporate earnings are far from catching up with market expectations. If FIIs and DIIs keep trading at cross purposes, upside for both indices will remain capped. Stay invested but maintain trailing stop-losses.  

Friday, May 19, 2017

Stock Chart Pattern – Diamines and Chemicals (an update)

Shortly after posting the previous update, the stock chart pattern of Diamines and Chemicals had entered a long bear phase that finally ended at a closing low of 18 in Mar '14.

The subsequent rally took the stock price to a high of 50 in Sep '14 - a quick return of 177% in 6 months. Another correction ensued. The stock formed a 'double bottom' reversal pattern during Mar-Jun '15.

That was a signal that the bear phase had finally come to an end. But bulls didn't have it easy.


The stock price rose to a lower top of 46.40 on Aug 5 '15 and began a long sideways consolidation within a 'rectangle' pattern. A 'rectangle' - though unreliable - is usually a continuation pattern.

Since the stock price had entered the 'rectangle' from below, the expected breakout from it was upwards. The breakout finally occurred with good volume support on Oct 25 '16, after a couple of failed attempts.

A pullback towards the top of the 'rectangle' found good support from the rising 50 day EMA on Nov 18. The next leg of the rally ensued - giving an opportunity to enter for those who may have missed buying during the initial breakout above the 'rectangle'.

The stock faced resistance from the 72 level in Jan '17 and corrected nearly 20 points to a low of 52.50 on Feb 16 '17. The subsequent rally took the stock past 72 to a new closing high of 84.25 on May 16 '17 before correcting a bit.

Daily technical indicators are in the process of correcting overbought conditions. The company has declared very good Q4 (Mar '17) results after a couple of years of poor performance. Dips can be used to add. 

Wednesday, May 17, 2017

Nifty chart: a midweek technical update (May 17 ‘17)

Both FIIs and DIIs were net buyers of equity - worth Rs 3.6 Billion and Rs 1.5 Billion respectively - during the first three days of trading this week. Nifty rose to close above the 9500 mark for the first time ever.

Interestingly, FIIs turned net sellers today after two days of net buying while DIIs were net buyers today after two days of net selling. Reminds me of an African proverb: When two elephants fight the grass gets trampled. 

India's exports grew nearly 20% in Apr '17, but imports grew 49% due to a sharp jump in gold and oil imports. As a result, the trade deficit grew to a 29-months high of US $13.2 Billion against $4.8 Billion in Apr '16.


Strong FII buying propelled the daily bar chart pattern of Nifty to a close above the 9500 level for the first time ever on Tue. May 16. Though the index touched new intra-day and closing highs today, it was on the back of DII buying as FIIs were in profit-booking mode.

All three daily technical indicators are looking overbought. The index is trading above its three rising EMAs in a bull market, but the distance between the index and its 200 day EMA is in excess of 800 points - which is another sign of overbought conditions.

Nifty's TTM P/E has crossed above 24 - much higher than its long-term average. The breadth indicator NSE TRIN (not shown) has dropped back inside its overbought zone after attempting to emerge from it.

An index can remain overbought for long periods. That doesn't mean it will be a one-way rise to new highs every day. 

If FIIs continue to book profits, a sharp correction can follow. Such a correction, if and when it occurs, will improve the technical 'health' of the chart and provide an entry opportunity.

Till then, stay invested with a trailing stop-loss and enjoy the bull ride.

Tuesday, May 16, 2017

WTI and Brent Crude Oil charts: sharp bear market rallies providing selling opportunities

WTI Crude Oil chart


The daily bar chart pattern of WTI Crude Oil plunged below 44 with a volume surge on May 5, but bounced up to close higher - forming a 'reversal day' bar (lower low, higher close) that marked the end of the corrective move from its Apr 12 top.

The subsequent rally took oil's price past its 20 day and 200 day EMAs towards 50, but faced strong resistance from the falling 50 day EMA and closed below the 200 day EMA in bear territory.

Bulls may heave a sigh of relief that the 'death cross' of the 50 day EMA below the 200 day EMA has been prevented. Bears will point out that the 3 months long bearish pattern of 'lower tops, lower bottoms' is still in force.

Daily technical indicators are looking bullish and showing upward momentum after correcting oversold conditions. However, MACD is still in bearish zone and RSI is in neutral zone.

The rally may continue till 51-51.50. Expect bears to start selling at any time.

Energy ministers of Russia and Saudi Arabia suggested that current production cuts should get extended till Mar '18. That triggered Monday's price spurt. Other OPEC and non-OPEC producers may not agree to any extended production cuts.

On longer term weekly chart (not shown), oil's price faced resistance from its 50 week EMA and closed below its three weekly EMAs in a long-term bear market. Weekly technical indicators are in bearish zones. Slow stochastic is showing positive divergence by touching a higher bottom.

Brent Crude Oil chart


The daily bar chart pattern of Brent Crude Oil dropped sharply towards 46.50 on May 5, but pulled back with strong volume support to close at 49.50. 

In the process, oil's price formed a 'reversal day' bar (lower low, higher close) that marked the end of the intermediate down trend from its Apr 12 top.

The subsequent rally faced resistance from the falling 50 day EMA, but oil's price managed to close just above its 200 day EMA in bull territory. 

Daily technical indicators have corrected oversold conditions and are showing upward momentum. Only Slow stochastic is in bullish zone. MACD is in bearish zone and RSI is in neutral zone.

The rally may have further upside - to 53-53.50. But bears are likely to 'sell the rise' at any time.

On longer term weekly chart (not shown), oil's price faced resistance from its 20 week EMA and closed at its 50 week EMA, but is trading well below its 200 week EMAs in a long-term bear market. Weekly technical indicators are in bearish zones. Slow stochastic is showing positive divergence by touching a higher bottom.

Monday, May 15, 2017

S&P 500 and FTSE 100 charts (May 12 '17): bears fighting a losing battle?

S&P 500 index chart pattern


The following remark was made in last week's post on the daily bar chart pattern of S&P 500: "The 2400 level has been tested twice in 8 trading sessions, and may get breached soon."

On Tue. May 9, the index touched a new intra-day high of 2404, but closed 3 points below the previous day's closing level of 2399 - forming a 'reversal day' bar (higher high, lower close) that triggered a correction.

The index received good support from its rising 20 day EMA, and bounced up to close above 2390 - losing 8 points on a weekly closing basis.

Daily technical indicators are in bullish zones, but showing downward momentum. All three are showing negative divergences by failing to touch new highs with the index.

Some more correction or consolidation is likely before a convincing break out above 2400 can occur. 

On longer term weekly chart (not shown), the index closed well above its three rising weekly EMAs in a long-term bull market. Weekly technical indicators are showing negative divergences and looking overbought.

FTSE 100 index chart pattern


The daily bar chart pattern of FTSE 100 faced resistance from the (purple) down trend line on Tue. May 9 but broke out above the trend line on the following day. (The possibility was mentioned in last week's post.)

The index rallied past the 7400 level on Fri. May 12 and closed at 7435 - with a 1.9% gain for the week. The 7 weeks long down trend has ended. A test of the Mar 17 top of 7447 is likely.

Daily technical indicators are in bullish zones and showing upward momentum. Slow stochastic is well inside its overbought zone, and can trigger a pullback towards 7400.

The index is trading above its three EMAs in a bull market. A convincing move above 7450 will put bulls back in the driver's seat.

On longer term weekly chart (not shown), the index closed well above its three weekly EMAs in a long-term bull market. Weekly technical indicators are in bullish zones and showing upward momentum.

Sunday, May 14, 2017

Sensex, Nifty charts (May 12, 2017): touch new highs on the back of FII buying

In a surprising change of strategy near a market top, FIIs turned net buyers of equity - worth Rs 28.3 Billion. DIIs turned net sellers of equity worth Rs 13.0 Billion.

Sensex and Nifty touched new highs during the week, and closed at their highest ever weekly closing levels.

Calculated according to new series (base year shifted to 2011-12 from 2004-05), IIP rose 2.7% in Mar '17 against 1.9% in Feb '17; WPI inflation declined to a 4 months low of 3.85% in Apr '17 against 5.29% in Mar '17; CPI inflation declined to 2.99% in Apr '17 against 3.81% in Mar '17.

For FY 2016-17, IIP grew 5% against 3.4% in FY 2015-16. However, as per old series, IIP growth was a dismal 0.7% in FY 2016-17 against 2.5% in FY 2015-16.

BSE Sensex index chart pattern


The daily bar chart pattern of Sensex received good support from 'fan line 3' and its 20 day EMA during the week. It rose to touch a new high of 30366 on Thu. May 11 but corrected a little by the end of the week.

All three EMAs are rising, and the index is trading above them in a bull market. However, the bullish structure is looking a bit shaky as any downward breach of 'fan line 3' can bring bears to the fore.

Daily technical indicators are in bullish zones, but giving conflicting signals. MACD and ROC are showing negative divergences by failing to touch new highs with the index. RSI and Slow stochastic are looking overbought. Of the four indicators, only Slow stochastic is showing upward momentum.

Bulls may feel encouraged that FIIs have resumed buying. But DII selling is likely to act as a brake to the Sensex rally.

Stay invested and carry on with your SIPs.  

NSE Nifty index chart pattern


The weekly bar chart pattern of Nifty touched a new intra-week high of 9451 and closed just above 9400 for the first time ever.

The index is trading well above its two rising weekly EMAs in a bull market.

Weekly technical indicators are looking overbought. Three of them - ROC, RSI, Slow stochastic - are showing negative divergences by failing to touch new highs with the index.

With FIIs resuming their buying, liquidity inflow may push the index even higher. But the higher the index climbs, the sharper will be the subsequent correction.

Nifty's TTM P/E is at 23.88 - much higher than its long-term average. The breadth indicator NSE TRIN (not shown) is rising inside its overbought zone - hinting at some correction or consolidation.

Bottomline? Sensex and Nifty charts touched new highs during the week. Both indices are looking overbought. Earnings are yet to catch up with growth expectations. With FIIs and DIIs at cross purposes, upside for both indices may be limited. Stay invested but avoid any impulsive buying.  

Friday, May 12, 2017

The stock market is at a lifetime high - should you buy, sell or hold?

A TV anchor was interviewing a fund manager when the market started to correct after touching a new high. The following is a brief excerpt of the Q&A session:

Q: You are holding 16% in cash. Is it because you are expecting a big correction in the market?

A: It's not like that. We hold a basket of stocks and have price targets for each stock. When a target is hit, we book profits.

Q: You mean several stocks have hit their targets during the recent rally - that is why you have excess cash? Why are you not redeploying in other stocks?

A: It is difficult to find new ideas near a market top, as everything appears overvalued. So, we have invested in money market instruments.

This is a classic problem that fund managers face. They can't afford to hold large amounts of cash because it affects fund performance. But they are wary of redeploying at high valuations in case the market turns against them.

Small investors with a long-term outlook need not be bothered by such a problem - provided they have a proper asset allocation plan.

The asset allocation plan will determine the investment strategy. How?

Let us look at an example - a plan with 70% in equity shares, 25% in fixed income instruments and 5% in cash. That means, out of a monthly saving of Rs 10000, Rs 7000 is being invested in an equity fund, Rs 2500 in a debt fund and Rs 500 in a liquid fund.

After a year, the invested amounts are Rs 84000 in the equity fund, Rs 30000 in the debt fund and Rs 6000 in the liquid fund

Due to the bull rally, the NAV of the equity fund has gone up 20% - so the amount in the equity fund has increased to Rs 100800. The amount in the debt fund has increased to Rs 31500 (say), and the amount in the liquid fund is Rs 6500.

The asset allocation has now changed (due to the rally) to 73% in equity fund, 22.5% in debt fund and 4.5% in liquid fund.

You now have three options: 
(i) book partial profits in equity fund and redeploy in debt and liquid funds to restore the original allocation and continue with your monthly SIPs; 
(ii) restore the original allocation by adjusting your monthly SIPs by investing less in equity fund and more in debt and liquid funds; 
(iii) continue with your monthly SIPs and ride the bull rally a little longer - allowing the equity allocation to rise to 75% before choosing options (i) or (ii).

From the point of view of simplicity, option (i) is the least complicated. The reallocation is suggested after one year to avoid paying any long-term capital gains tax on your equity fund profits.

What about the answer to the question? As was mentioned earlier - you have no need for it.

Wednesday, May 10, 2017

Nifty chart: a midweek technical update (May 10 ‘17)

The concluding comment in last week's update was: "Unless FIIs stop selling, the index may not move much higher."

Did FIIs get motivated by the comment? They surprisingly turned net buyers of equity - worth Rs 6.84 Billion - during the first three days of trading this week. As per provisional figures, DIIs were net sellers of equity worth Rs 4.5 Billion.

Nifty, which had been consolidating sideways in a narrow range for the past 10 trading sessions, broke out and closed above 9400 for the first time since inception.

The Indian Meteorological Department's projection of a normal monsoon this year was probably the real impetus behind FII buying.


The daily bar chart pattern of Nifty rose to touch new intra-day (9415) and closing (9407) highs today. All three EMAs are rising, and the index is trading above them in a bull market.

Short-covering during the next couple of days may propel the index even higher, but bulls should be wary of celebrating too soon. Why?

Several technical reasons come to mind. The breakout today was not accompanied by any significant increase in volumes. All three technical indicators are showing negative divergences by failing to touch new highs with the index. 

Nifty's TTM P/E has risen to 23.89 - much higher than its long-term average. The breadth indicator NSE TRIN (not shown) has moved up a bit but remains inside its overbought zone.

A bull market is supposed to climb a wall of worries. Nifty appears to be doing just that. 

Remain cautiously optimistic and stay invested with a trailing stop-loss. Corporate earnings are yet to catch up with index valuation. 

Tuesday, May 9, 2017

Gold and Silver charts: bears reassert themselves

Gold chart pattern


The daily bar chart pattern of Gold has succumbed to another strong bear attack, and dropped to close below its three EMAs in bear territory.

Gold's price has bounced up after receiving support from the 1220 level - maintaining a bullish pattern of 'higher tops, higher bottoms' since rallying from its Dec '16 low.

Note that both the 20 day and 50 day EMAs have formed 'rounding top' reversal patterns, and are falling towards the 200 day EMA. Gold's sojourn into bull territory may be coming to an end.

Daily technical indicators are looking bearish. MACD and RSI are showing negative divergences by touching lower bottoms. Slow stochastic is deep inside its oversold zone, and can trigger a pullback rally towards the 200 day EMA.

Bulls need to defend the support zone between 1180 and 1200. Otherwise, bears will take complete control of the chart.

On longer term weekly chart (not shown), gold’s price has closed below its three weekly EMAs in a long-term bear market. Weekly technical indicators are looking bearish and showing downward momentum.

Silver chart pattern


The daily bar chart pattern of Silver faced relentless selling by bears - dropping below its three EMAs and its Mar '17 low into bear territory.

The imminent 'death cross' of the 50 day EMA below the 200 day EMA will technically confirm a return to a bear market.

Daily technical indicators are looking bearish and oversold. A pullback rally towards 16.75 is a possibility. Bears may  use any rally to sell again.

On longer term weekly chart (not shown), silver’s price closed below its three weekly EMAs in a long-term bear marketWeekly technical indicators are looking bearish and showing downward momentum.