Tuesday, January 9, 2018

Gold and Silver charts: pullback rallies halted

Gold chart pattern


The following comments had appeared in the previous post on the daily bar chart pattern of Gold"The pullback rally has been accompanied by receding volumes. The rally may not last long. Another bear onslaught can occur at any time."

A sliding US Dollar index ensured that the rally continued till the first week of the New Year. It was good while it lasted. But all good things must come to an end.

Daily technical indicators are beginning to correct overbought conditions. Gold's price may seek support from the zone between 1300-1310. But the support is likely to fail because the US Dollar index is recovering.  

On longer term weekly chart (not shown), gold’s price closed well above its three weekly EMAs in long-term bull territory.  Weekly MACD and RSI are in bullish zones. Slow stochastic is inside its overbought zone, and can trigger a correction.

Silver chart pattern


The daily bar chart pattern of Silver followed in the footsteps of the yellow metal - rallying smartly above its three daily EMAs into bull territory.

Bears have jumped back into the fray after silver's price failed to close above the 17.30 level despite a couple of attempts. A pullback towards the 200 day EMA has started.

Daily technical indicators have started correcting overbought conditions. Silver's price may drop back inside bear territory soon.

On longer term weekly chart (not shown), silver’s price closed above its 20 week and 50 week EMAs, but below its sliding 200 week EMA in a long-term bear marketWeekly MACD is still in bearish zone. RSI has started moving down after crossing above its 50% level. Slow stochastic has entered its overbought zone, and can trigger a correction.

Monday, January 8, 2018

S&P 500 and FTSE 100 charts (Jan 05, 2018): touch lifetime highs

S&P 500 index chart pattern


The following comment was made in the previous post on the daily bar chart pattern of S&P 500: "Since the index is trading above its three rising EMAs in a bull market, an upward breakout from the 'flag' is the most logical outcome."

Bulls literally jumped out of the blocks in the New Year. The index broke out above the 'flag' pattern on Jan 2 and then soared to a new high (2743) on Jan 5.

All three EMAs are rising, and the index is trading way above them in a bull market. Daily technical indicators are well inside their overbought zones, and can trigger a pullback towards the top of the 'flag'.

Can the index go on rising in 2018? It would help bulls technically if there is a decent 5-10% correction first. On long-term weekly and monthly charts, RSI has reached overbought levels not seen in 20 years, as per this article

On longer term weekly chart (not shown), the index closed at a lifetime high - way above its three rising weekly EMAs in a long-term bull market. Weekly technical indicators are well inside their overbought zones. Slow stochastic is showing negative divergence by failing to touch a new high. 

FTSE 100 index chart pattern


The daily bar chart pattern of FTSE 100 faced just a day of profit booking when trading began in the New Year on Jan 2. Bulls jumped in to 'buy the dip'. The index rose to touch new intra-day (7728) and closing (7724) highs on Jan 5.

The index is trading well above its three rising EMAs in a bull market. Daily technical indicators are looking overbought. RSI and Slow stochastic are showing negative divergences by failing to touch new highs with the index.

Some correction or consolidation is likely. Stay invested, but control the urge to buy when the index is at a lifetime high. (At the time of writing this post, FTSE is trading 8 points lower.)

On longer term weekly chart (not shown), the index touched a new high and closed above its three rising weekly EMAs in a long-term bull market. Weekly MACD and RSI are in bullish zones but showing negative divergences by failing to touch new highs with the index. Slow stochastic is well inside its overbought zone and can trigger a correction.

Sunday, January 7, 2018

Sensex, Nifty charts (Jan 05, 2018): touch new highs again as FIIs turn bulls

In an apparent change of stance, FIIs turned net buyers of equity - worth Rs 17.4 Billion - during the first week of trading in 2018. DIIs were net sellers of equity worth Rs 9.4 Billion as per provisional figures, but they were net buyers on Thu. & Fri. (Jan 4 & 5).

Sensex (34154) and Nifty (10559) closed at new highs at the end of the week, but haven't made much upward progress after breaking out above 'flag' patterns three weeks back.

The Nikkei India Services PMI rose to 50.9 in Dec '17 against 48.5 in Nov '17 (a number above 50 indicates expansion). The Composite PMI (Manufacturing plus Services) rose to 53 in Dec '18 against 50.3 in Nov '17 - highest since Oct '16.

BSE Sensex index chart pattern


The daily bar chart pattern of Sensex has been consolidating sideways within a 'rectangle' pattern for the past three weeks - after breaking out above a bullish 'flag' pattern.

The rising 20 day EMA has provided good downside support. On Fri. Dec 5, the index broke out and closed just above the 'rectangle' - on the back of combined FII and DII buying. But the breakout hasn't been a convincing one.

Daily technical indicators are in bullish zones. MACD is about to bounce up after seeking support from its signal line. ROC is trying to cross above its falling 10 day MA. RSI is moving sideways at the edge of its overbought zone. Slow stochastic has bounced up from the edge of its overbought zone.

All four indicators are showing negative divergences by failing to touch new highs with the index. A correction towards the lower edge (33700) of the 'rectangle' is possible.

Combined buying by FIIs and DIIs - like on Jan 4 & 5 - can propel the index higher. Let your asset allocation plan guide you on whether to buy, hold or book partial profits.

NSE Nifty index chart pattern


The weekly bar chart pattern of Nifty rose to touch new intra-week (10566) and closing (10559) highs during the first week of trading in 2018. The index is trading above its three rising weekly EMAs in a bull market.

Despite bullish fervour (note the strong volume support), the index hasn't progressed very far above the 10490 level (the intra-week high touched 8 weeks back). 

Weekly technical indicators are in bullish zones. MACD has merged with its signal line at the edge of its overbought zone. RSI has entered its overbought zone after 5 months. Slow stochastic is well inside its overbought zone. ROC is looking bearish by falling from its overbought zone and crossing below its 10 week MA.

Nifty's TTM P/E has increased to 26.99 - well above its long-term average. The breadth indicator NSE TRIN (not shown) is rising inside its overbought zone, and can trigger a correction. 

Bottomline? Sensex and Nifty charts have closed at new highs but are in sideways consolidation zones. Concerns about Q3 (Dec '17) results have prevented bulls from charging ahead. Lower base effect may lead to some earnings growth in Q3. Any dips can be used to add to existing holdings.

(Note: Don’t worry about index fluctuations! Learn how to choose fundamentally strong mid-cap and small-cap stocks. Become a paid subscriber of my Monthly Investment Newsletter. A limited number of new subscriptions are being offered till Jan. 21, 2018. Enrollments have started. Contact me for details: mobugobu@yahoo.com.)

Friday, January 5, 2018

Top 5 India ETFs for 2018

An India ETF is not a buy-and-hold investment. You must consistently monitor not only each ETF’s performance, but also the condition of the economy in India. 

Here are the top five India ETFs by year-to-date returns as of December 28, 2017.

1. Direxion Daily MSCI India Bull 3x ETF (INDL)


2. VanEck Vectors India Small-Cap ETF (SCIF)


3. Columbia India Small-Cap ETF (SCIN)


4. iShares MSCI India Small-Cap (SMIN)


5. Columbia India Infrastructure ETF (INXX)


(For expanded chart views, right click on the chart and open in a new tab.)

Read the full article here: 

Wednesday, January 3, 2018

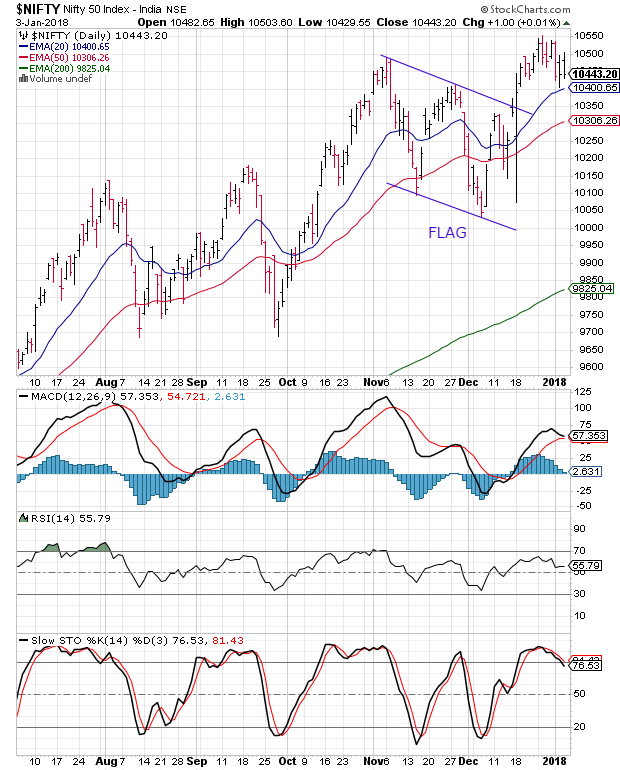
Nifty chart: a midweek technical update (Jan 03 ‘18)

During the first three days of trading in 2018, FIIs were net buyers of equity worth Rs 9.4 Billion. DIIs were net sellers of equity worth Rs 15 Billion, as per provisional figures. Nifty lost 88 points (0.8%), and is back where it was in the beginning of Nov '17.

Nikkei India's Manufacturing PMI rose to a 5 years high of 54.7 in Dec '17 against 52.6 in Nov '17. (A figure above 50 indicates expansion.) The stock market remained unmoved by the positive news, which is a bearish sign.

Dec '17 auto sales showed good YoY growth, albeit on a lower base due to demonetisation. Ashok Leyland (79%), Tata Motors (52%), Hero Moto (43%), TVS Motors (39%), Bajaj Auto (30%) showed excellent growth. Eicher (17%), Escorts (13%), Maruti (10%), Hyundai (10%), M&M (8%) showed decent growth. 


After breaking out above a bullish 'flag' pattern and touching a lifetime high of 10552 on Dec 27, the daily bar chart pattern of Nifty had formed a 'reversal day' bar.

That triggered a pullback towards the top of the 'flag' - a possibility mentioned in last week's post. The index has bounced up after receiving support from its rising 20 day EMA.

Daily technical indicators are in bullish zones, but not showing any upward momentum. MACD and Slow stochastic are correcting overbought conditions. RSI is moving sideways above its 50% level.

Some more correction towards the top of the 'flag' and the rising 50 day EMA is likely. The dip can be used to add to existing holdings.

Nifty's TTM P/E has eased a bit to 26.7 but remains much higher than its long-term average. The breadth indicator NSE TRIN (not shown) has bounced up from deep inside its overbought zone - hinting at some more correction.

Q3 (Dec '17) corporate results are expected to be announced from next week. A low base effect due to demonetisation can lead to improved earnings growth. 

(Note: If you already have a stock portfolio, and are looking to add good quality mid-cap and small-cap stocks, subscribe to my Monthly Investment Newsletter. A limited number of paid subscriptions are being offered till Jan 21, 2018.)

Tuesday, January 2, 2018

WTI and Brent Crude Oil charts: breakout above consolidation zones to touch 2.5 yr highs

WTI Crude Oil chart


The daily bar chart pattern of WTI Crude Oil broke out above the 'symmetrical triangle' pattern within which it was consolidating for 5 weeks. The possibility of such an upward breakout was mentioned in the previous post

An explosion on a Libyan crude pipeline triggered by armed assailants on Tue. Dec 26 cut Libya's oil production by 100,000 barrels per day. The news may have aided the upward breakout.

Note that volumes during the upward breakout was not significantly higher - a required condition for a technically valid upward breakout. Perhaps a truncated trading week due to Christmas holidays and year-end considerations contributed to the lower volumes.

Oil's price ended the week, month and year at a 2.5 years high of 60.42. All three EMAs are rising, and oil's price is trading well above them in a bull market. 

Daily technical indicators are in bullish zones, but showing negative divergences by failing to touch new highs with oil's price. Slow stochastic is looking overbought. 

A pullback towards the top of the 'symmetrical triangle' is a possibility. Bulls may use the dip to buy.

On longer term weekly chart (not shown), oil's price closed above its three weekly EMAs in long-term bull territoryWeekly technical indicators are looking overbought and may trigger a pullback towards the 200 day EMA.

Brent Crude Oil chart


The following remark was made in the previous post on the daily bar chart pattern of Brent Crude Oil: "Some more consolidation within the 'rectangle' is likely before an eventual breakout."

The expected upward breakout occurred on Tue. Dec 26. News of an explosion on a Libyan crude oil pipeline may have triggered the breakout, but muted volumes failed to technically validate the breakout.

Oil's price ended the week, month and year at a 2.5 years high of 66.87. Daily technical indicators are looking bullish but showing negative divergences by failing to touch new highs with oil's price. A pullback towards the top of the 'rectangle' is a possibility.

On longer term weekly chart (not shown), oil's price closed above its three weekly EMAs in long-term bull territoryWeekly technical indicators are looking overbought. Slow stochastic is showing negative divergence by failing to touch a new high.

Monday, January 1, 2018

S&P 500 and FTSE 100 charts (Dec 29 '17): bulls clearly on top

S&P 500 index chart pattern


After touching a lifetime high of 2695 on Mon. Dec 18, the daily bar chart pattern of S&P 500 appears to be consolidating within a bullish 'flag' pattern from which the likely break out is upwards.

Daily technical indicators have corrected overbought conditions. MACD has crossed below its signal line and is about to drop from its overbought zone. RSI and Slow stochastic have fallen sharply from their respective overbought zones. Some more consolidation within the 'flag' is a possibility.

Can the index fall below the 'flag'? The possibility can't be ruled out. Since the index is trading above its three rising EMAs in a bull market, an upward breakout from the 'flag' is the most logical outcome. 

On longer term weekly chart (not shown), the index closed well above its three rising weekly EMAs in a long-term bull market. Weekly technical indicators are inside their overbought zones, but showing some signs of correcting. 

FTSE 100 index chart pattern


In a three day trading week truncated by Christmas holidays, the daily bar chart pattern of FTSE 100 rose to touch new intra-day (7698) and closing (7688) highs.

All three EMAs are rising, and the index is trading well above them in a bull market. Daily technical indicators are looking overbought. 

A pullback towards the 'resistance' line connecting the Jun '17 and Nov '17 tops is a possibility. A 'buy the dip' strategy can be followed. 

On longer term weekly chart (not shown), the index touched a new 3 year high and closed above its three rising weekly EMAs in a long-term bull market. Weekly technical indicators are in bullish zones but showing negative divergences by failing to touch new highs with the index.